The Volatility Control Fund Model

In this article will focus on a new model that we have released. It is another systematic strategy. In practice, all of these strategies, like we explained for the CTAs, are strategies that go long short based on specific price or volatility triggers.
What is the Volatility Control Fund Model?
So let’s start by understanding what a Volatility Control Fund is. It is a strategy designed to go long or short based on volatility levels. While some of these funds use VIX others can use implied volatility and realized volatility.
A lot of the time these strategies can be embedded in portfolios with the objective of protecting portfolios from extreme market fluctuations. They can be a good diversification from a traditional equity and bond portfolio.
The technique does vary, but from a portfolio perspective, to give you an example, if we target a 10% vol, and vol is at 10%, the model reduces positions in risky assets. If we are below 10% the model goes long risk assets.
Why do we want to track this strategy?
This strategy is worth understanding and following, because throughout the years exposure to it has become bigger. We are looking at around $350B in this strategy (give or take based on Morningstar numbers). That is about 2% of mutual funds and ETFs AUM.
The Volatility Control Fund Model in details
The model is based on the realized volatility level of the SPX index. The objective is to create a trigger that will lead vol control funds to go long or short based on that level of volatility.

Breaking it down
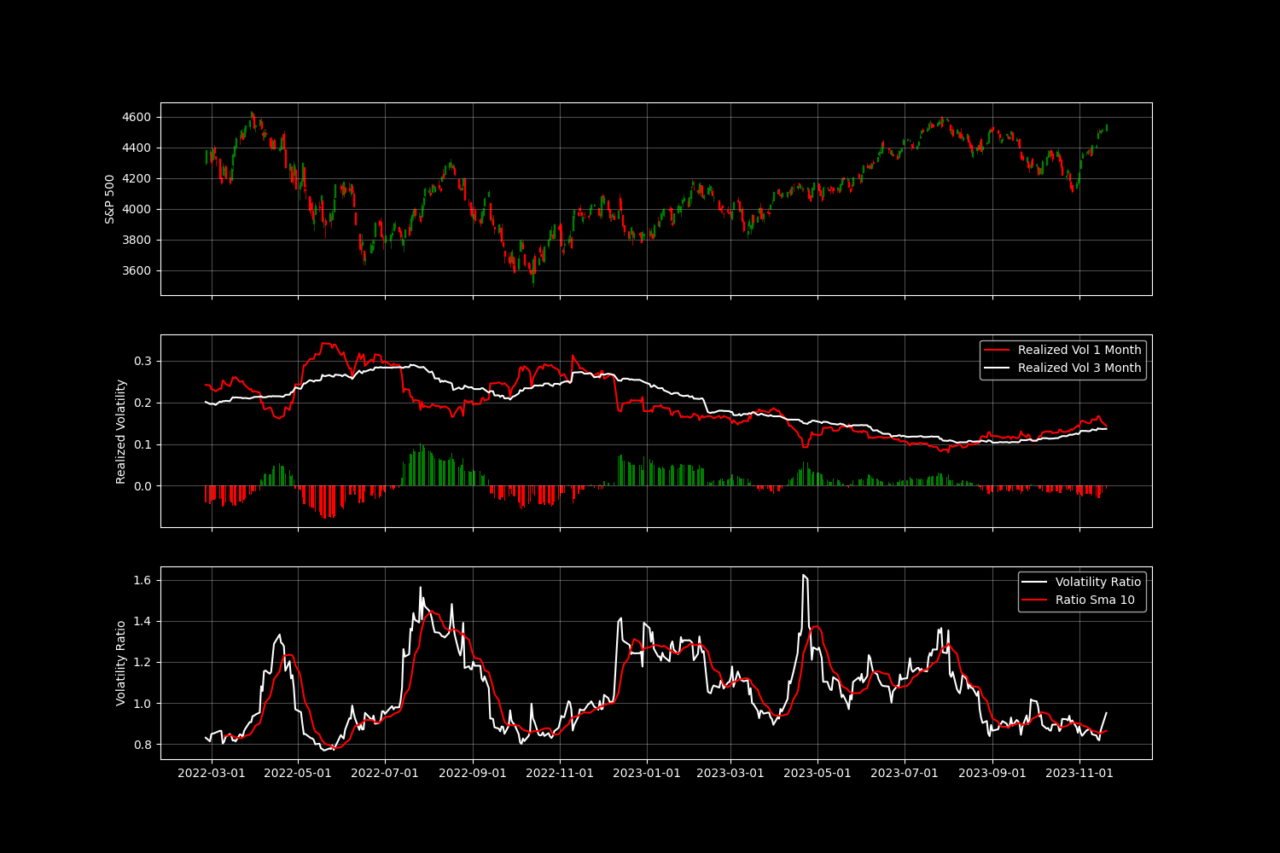
If we break it down, on the first part of the chart you can see simply the price of the SPX.
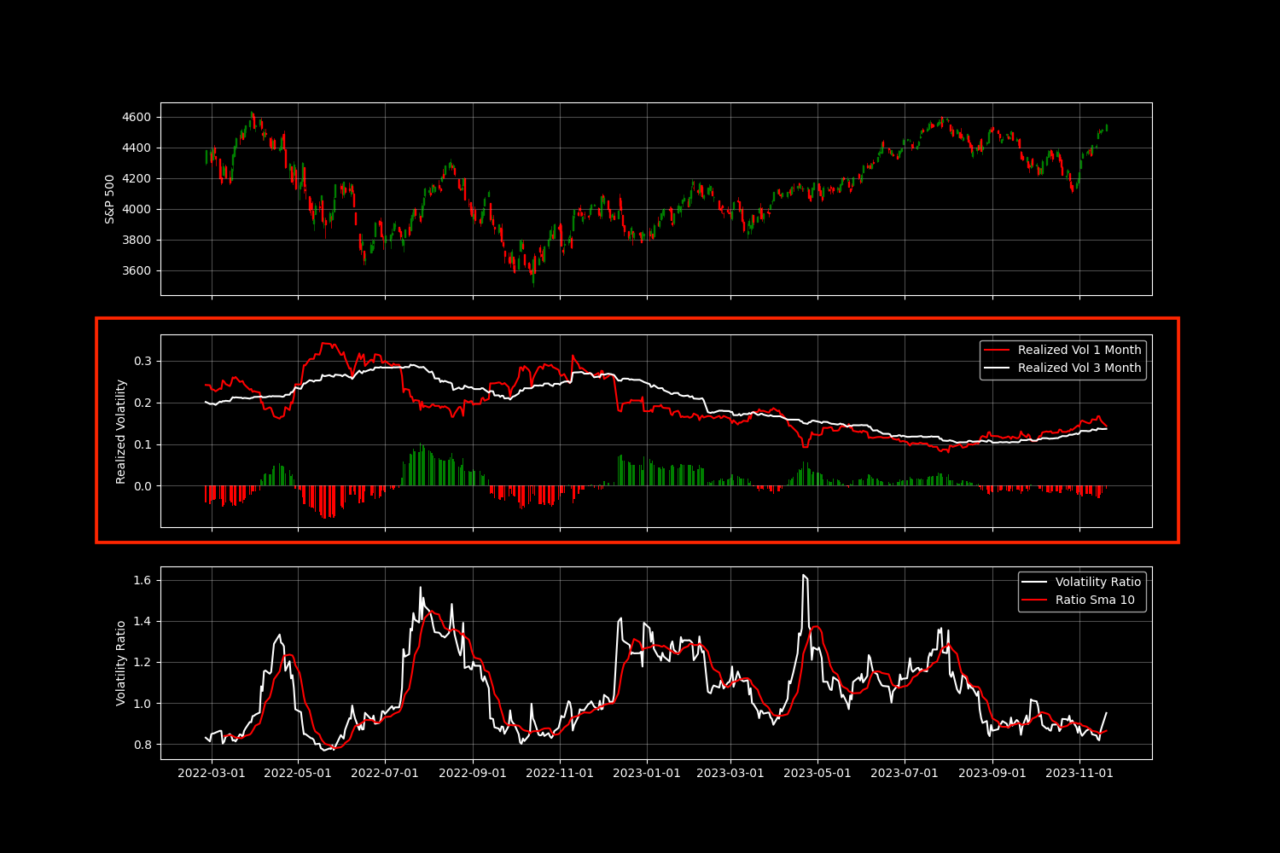
In the second part of the chart, we took 1 and 3 month realized volatility and compared it.

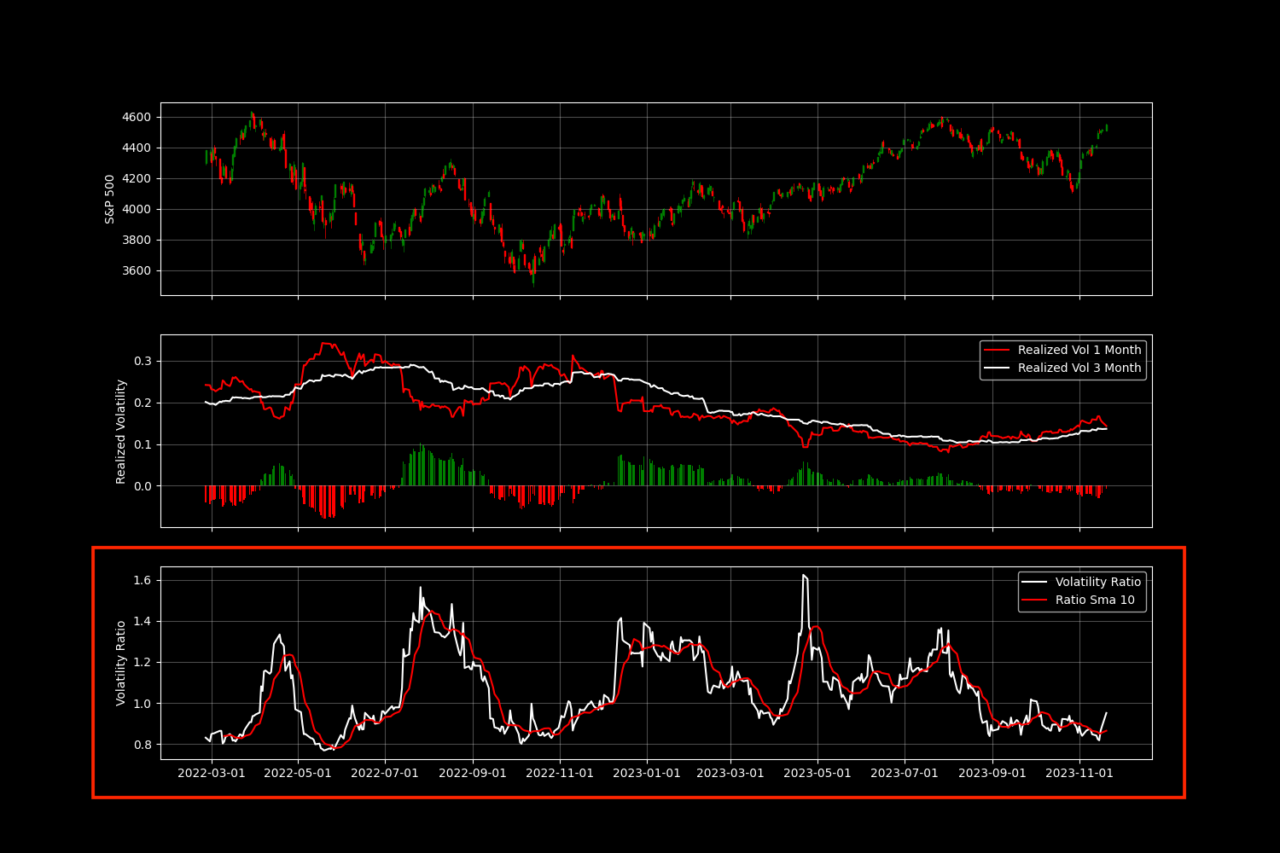
In the last part of the chart, that is where we created our trigger.
The Volatility Ratio is using Realized Vol 1 month against Realized Vol 3 months.
There are two triggers for our Volatility Control Funds:
- If Volatility Ratio is bullish the model goes long. If not it is either flat or short.
- SMA 10: we also use this second ratio as confirmation, when Vol Ratio goes above SMA that trigger a long in volatility.

How do we use the Volatility Control Model?
This model, from a liquidity perspective can be used in conjunction with our Greeks, and CTAs models. We like to mix up models to confirm our views.
To give you an example of how this could be useful to your strategy, let’s say we see a bearish market. This is how we would expect to see our models:
- Greeks: by looking at the Option Matrix we would expect to lose a bunch of GEX in the next few sessions. Drop in Open Interest and Volumes. Also look at the Bid/Ask Spread to confirm that strikes are becoming less liquid. The Net GEX Chart can also be used to see how GEX is being lost for the specific strikes.
- CTAs: these models have specific trigger prices. If we are close or reached a specific bearish price level, CTAs are shorting the market.
- Vol Control: in this case we want to see Vol Ratio spike, ideally above the SMA 10. What we are really looking for is a spike in 1 Month RV compared to the 3M RV. These situations would trigger Vol Control Funds to go long volatility.
You can access these Models within our Premium Membership.
