How to manage short term Momentum

The other day in one of our chat rooms, one of our traders asked this question:
“What’s the best way to gauge very short-term momentum? I have an OTM call expiring next week, and wonder whether I should sell or wait a couple of days.”
While we cannot predict the future, one thing we can do is use the data and models we have available to get a better understanding of positioning. This can help us to make better informed decisions. Let’s use the SPX to walk you through the data analysis using some of our charts.
This is what we will cover today:
- Net GEX
- Open Interest and Volume Profile
- Open Interest * Implied Volatility Profile
- 1D Expected Move Indicator
Net Gex
The first chat we look at is Net GEX. This chart allows us to see the strike levels that have more gamma.
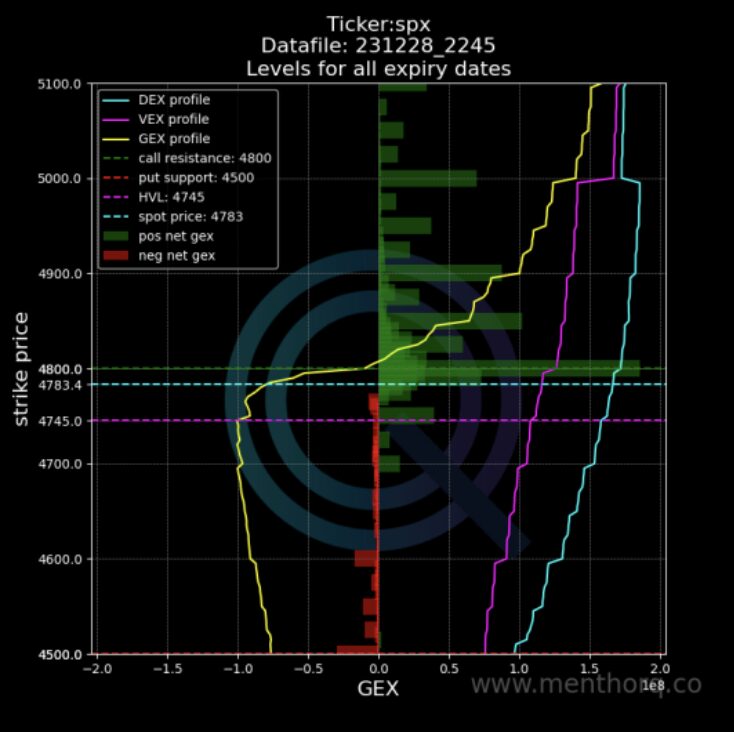
Going back to our question, this is how we could use this data:
- The first thing we would do is to check how close the spot price is to the High Vol Level. We do that, because if the spot gets closer to High Vol Level, then we would start seeing a shift in the gamma regime, and that has the potential to change the gamma landscape and volatility.
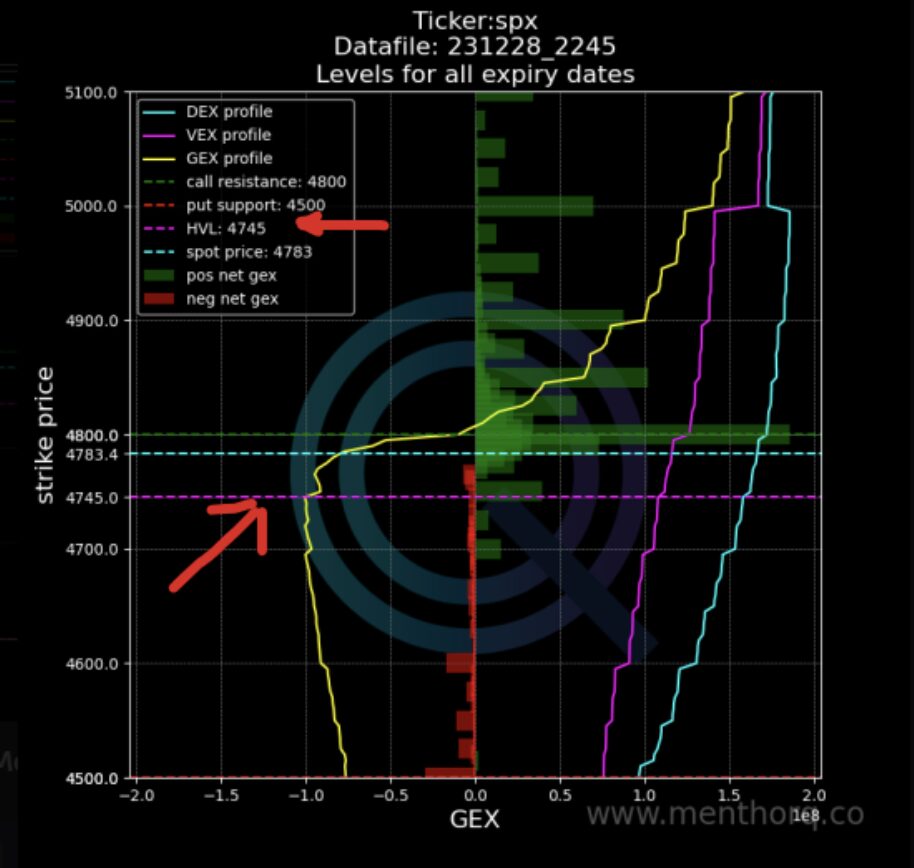
- Next we would want to see what are the closest sticky strikes to spot. Those levels, in certain situations, can act as magnets. As an example look at 4800 in this Net GEX chart.
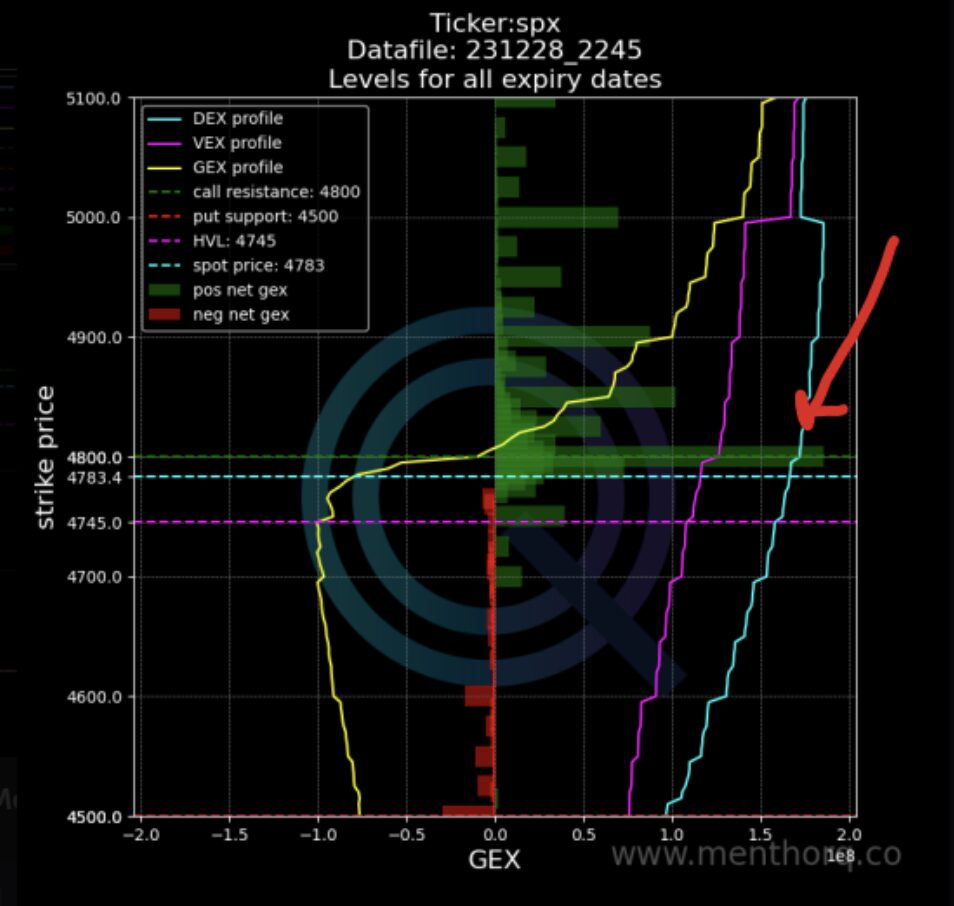
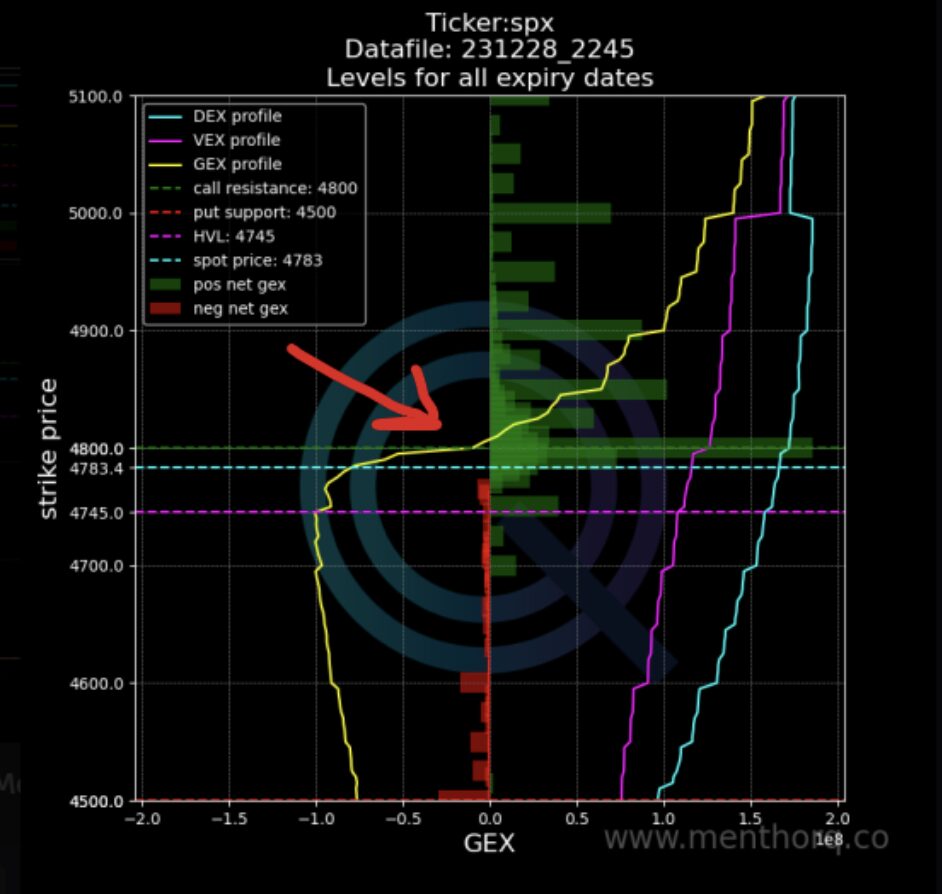
- The GEX Profile yellow line helps you follow the gamma profile. If that is positive, we can expect a low volatility regime, the opposite is true if it moves to a negative regime.
Open Interest and Volume
Next we jump into the Open interest and Volume Profiles.
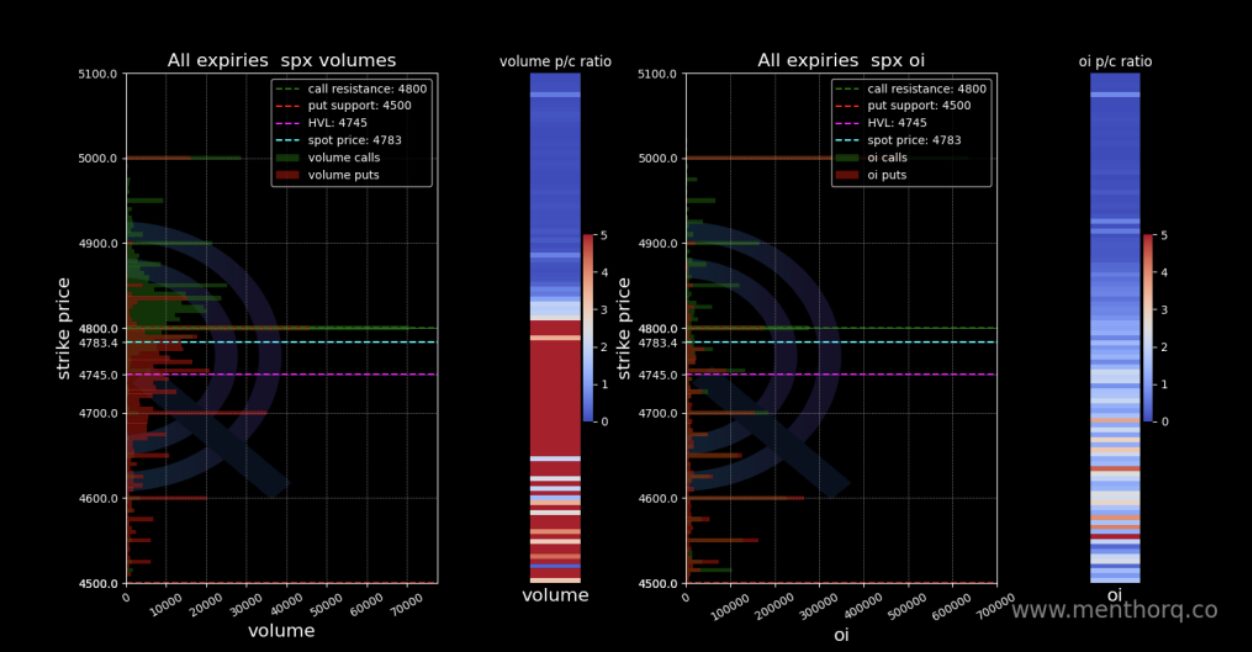
Volumes are on the left hand side, and open interest on the right. We use this chart to find Open interest nodes. Open Interest nodes are those high levels of open interest that have the potential of becoming sticky strikes. For example, you can take the spot price, compared to Net GEX, but also to the highest OI nodes close to the spot price. Let’s take our example. What do we see?
- 4800 is the Net GEX Level
- Spot is 4783
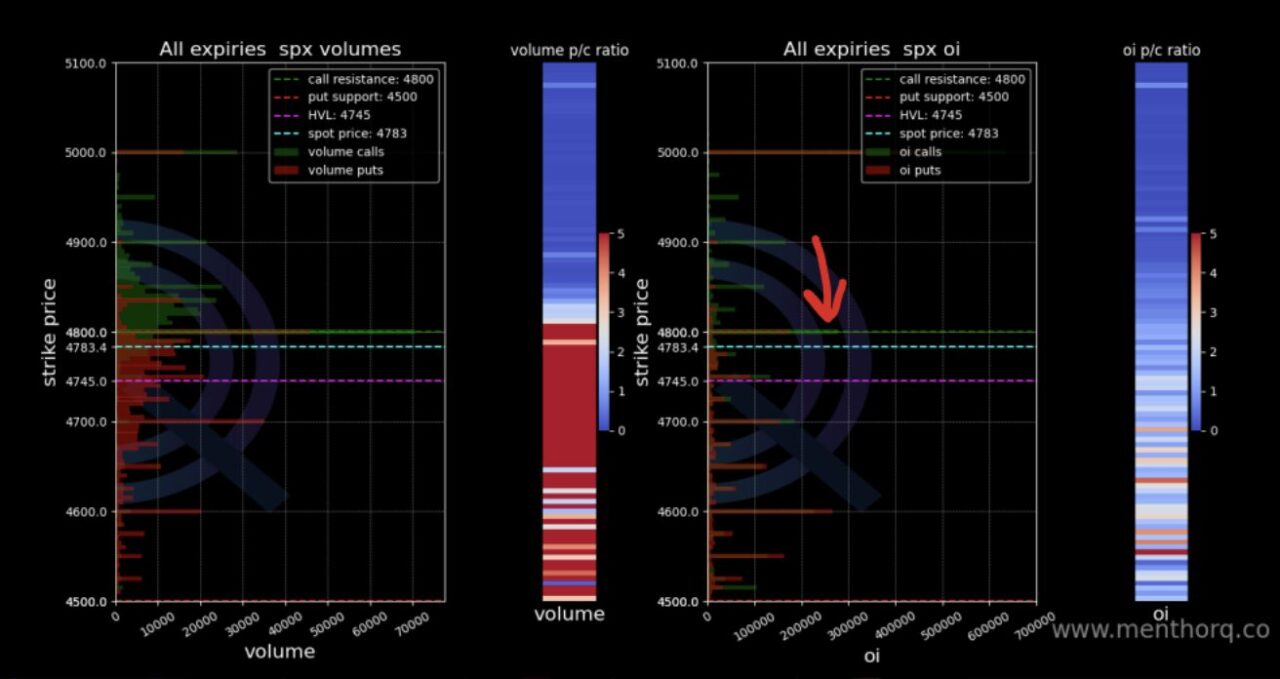
What we can see is that there is obviously a big OI and Volume around that 4800 big Net GEX level, but also a growing OI just below current spot price. You have confirmation of that also by looking at the volume profile.
Open Interest * Implied Volatility
Next we look at the OI*IV chart. This chart aggregates IV and OI by maturity for strike.
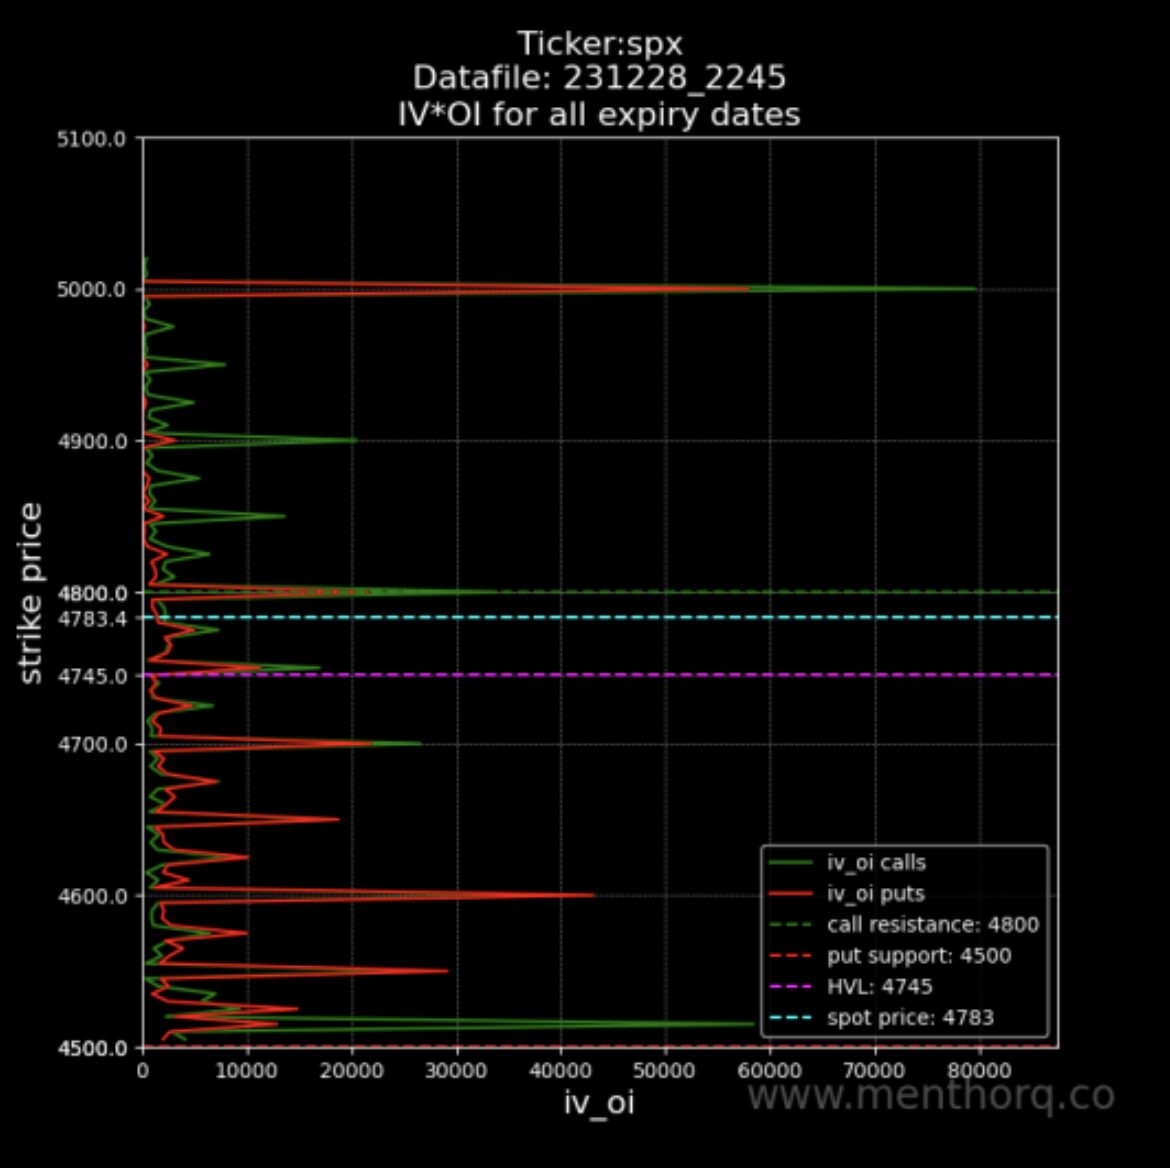
The objective of the chart is to confirm what strikes are more sticky from an OI and IV perspective. You have a profile by strike that has the sum of IV and OI per maturity.
When you see a spike it confirms that there are big OI nodes and there is high volatility on that strike.
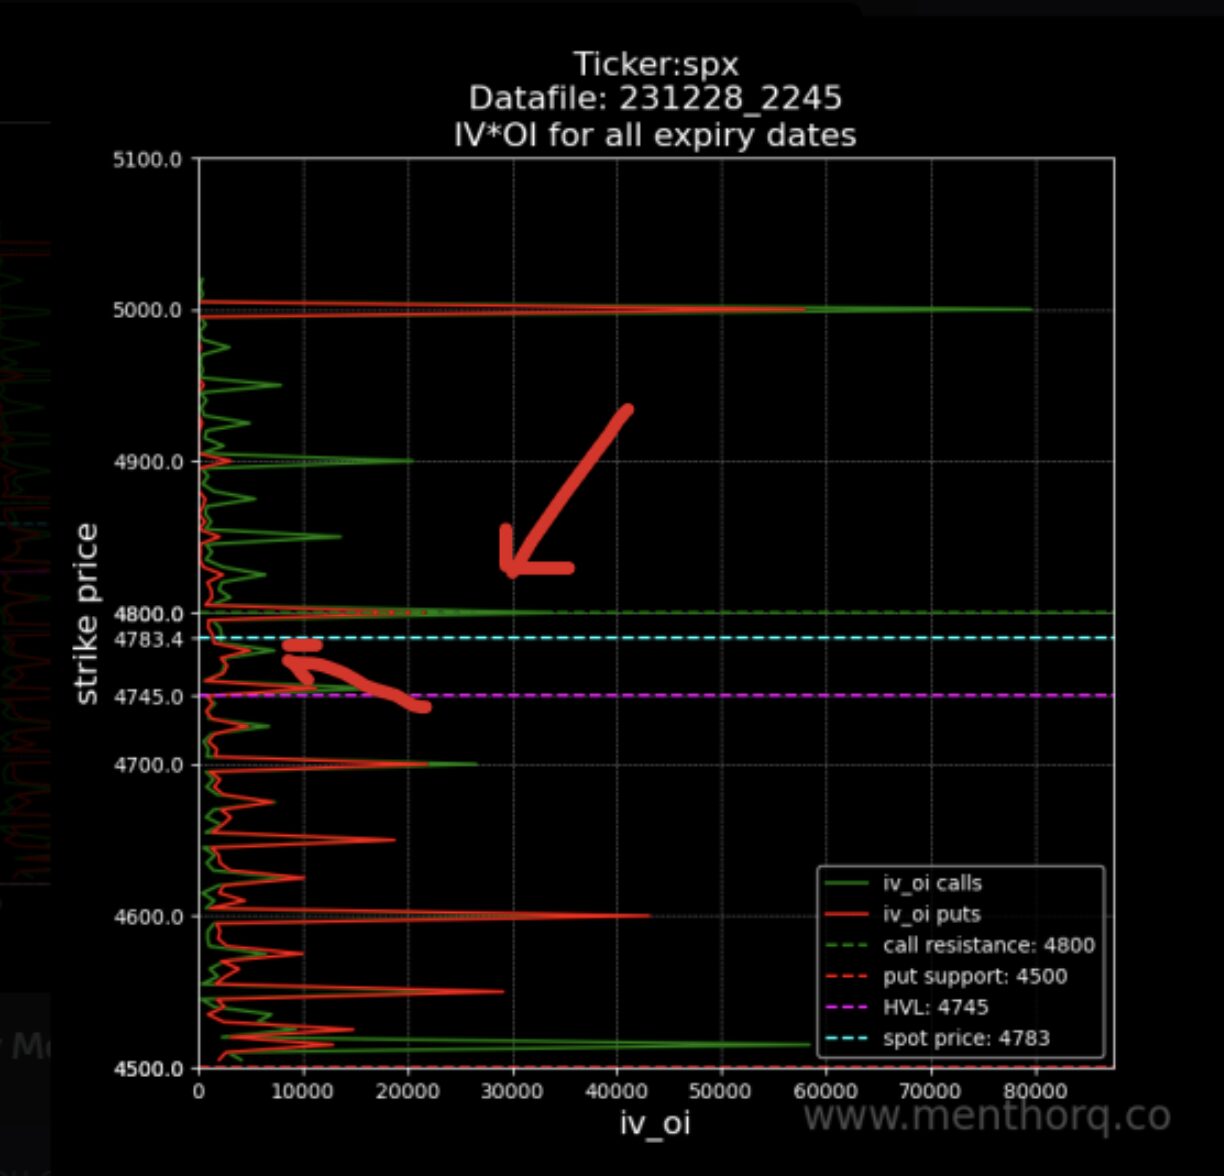
We use this chart to confirm sticky strikes. Again, we can see the big 4800 pop out, but it is also confirming the OI node we were seeing in the OI profile.
Menthor Q 1D Expected Move Indicator
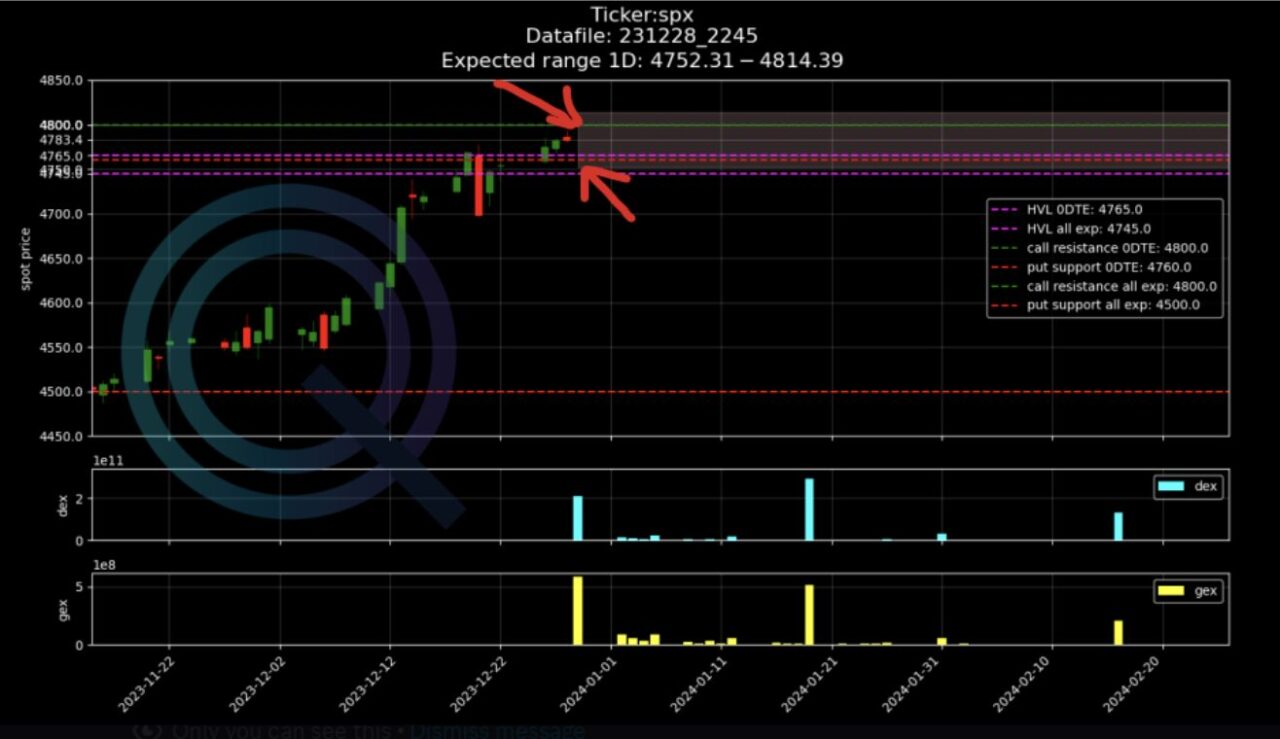
Finally we can use our proprietary indicator, the 1D Expected Move. By looking at volatility, we narrow down the potential expected price move for the next day. Obviously this is a projection, but once again you can compare this with what you are seeing in all other charts.
The 1D is between that big Net GEX level and the lower Open Interest node.
If you want to access all this Models and Data sign up for our Premium Membership.
