Headline
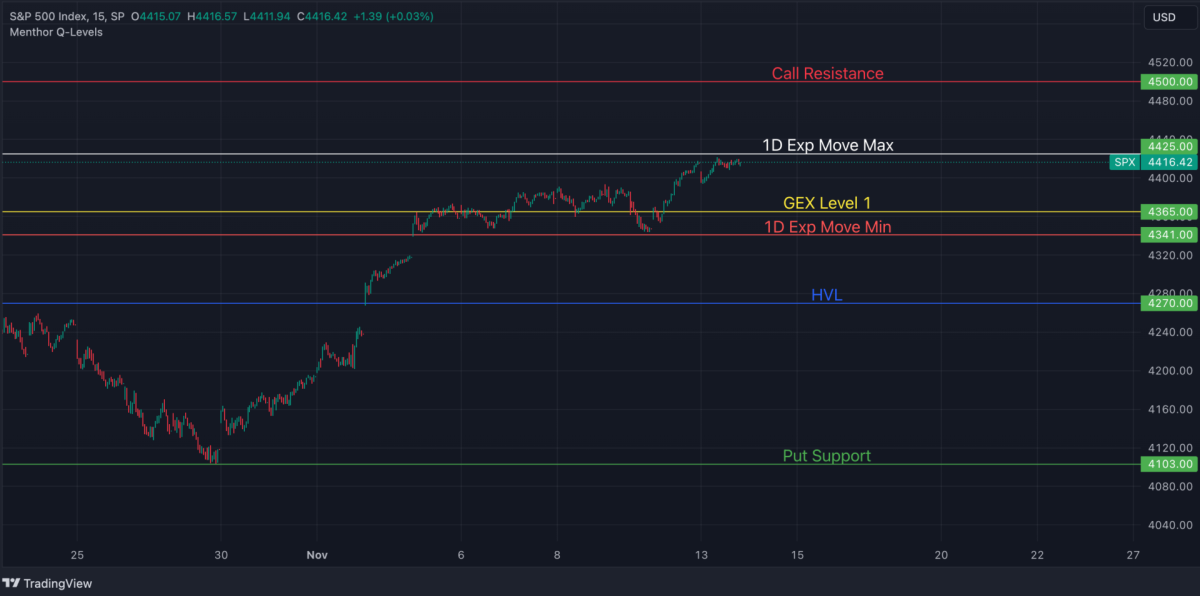
Headline
Market Positioning
Volatility
Sentiment
Risk Management
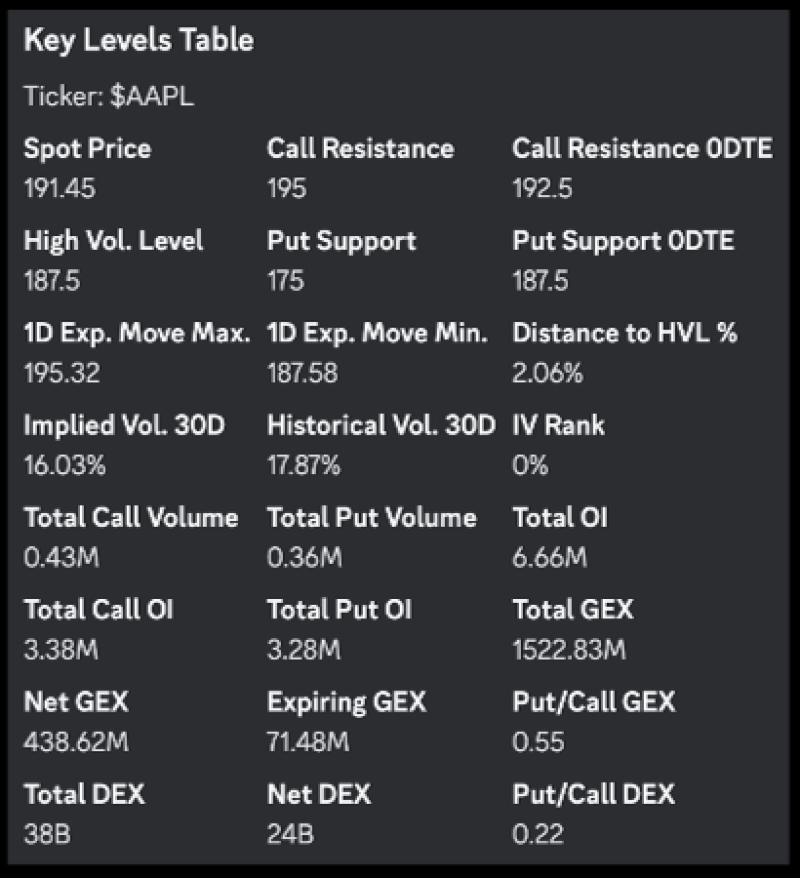
Delta Hedging
Knowing how Market Makers are hedging their books and the level of gamma in the market can help us pinpoint key levels and sticky strike prices. We use these levels to build directional strategies or leverage these levels in our options spread trades.
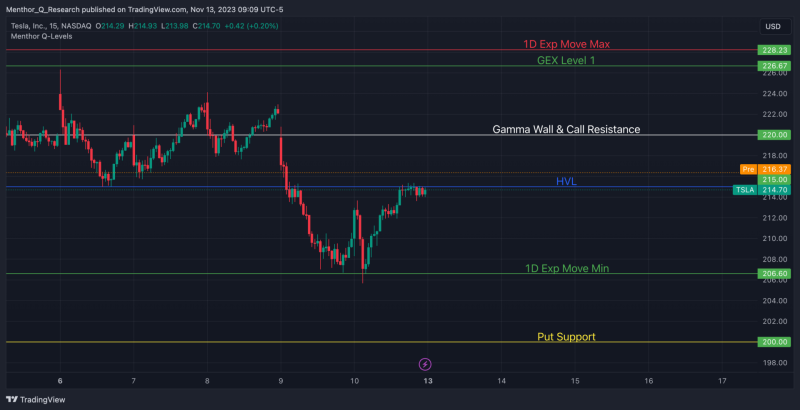
TradingView
By accessing the Menthor Q Levels Indicator on TradingView we can leverage the power of real time data and set up our strategy before the market opens. We can then monitor, create alerts and speed up our decision-making process.
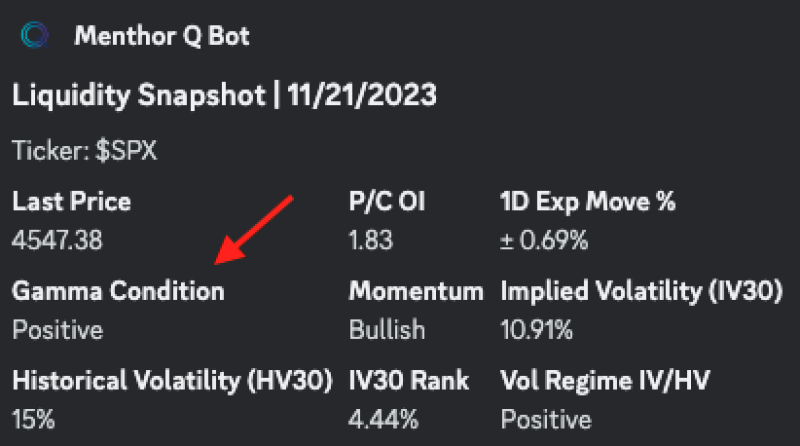
Positive and Negative Gamma
Understanding the Gamma Regime is key for our strategy. Market Makers hedge differently in Negative Gamma and this can have a direct impact on intraday price movements and trends.
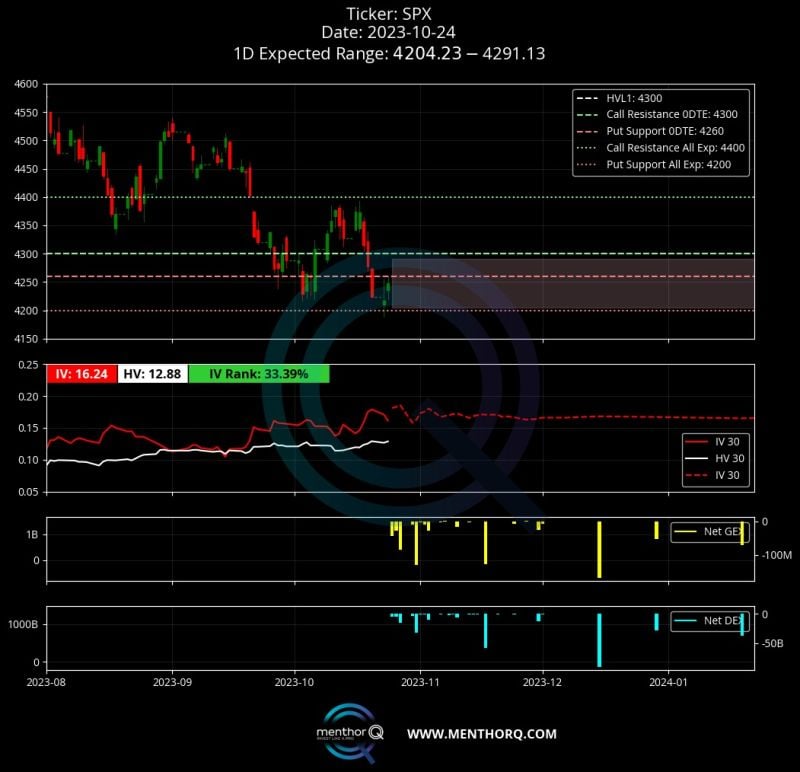
Primary Levels
Monitor the Key Primary Levels like the Call Resistance, High Vol Level and Put Support. These levels are the baseline for our market analysis. A break above or below these levels can change market positioning and volatility.
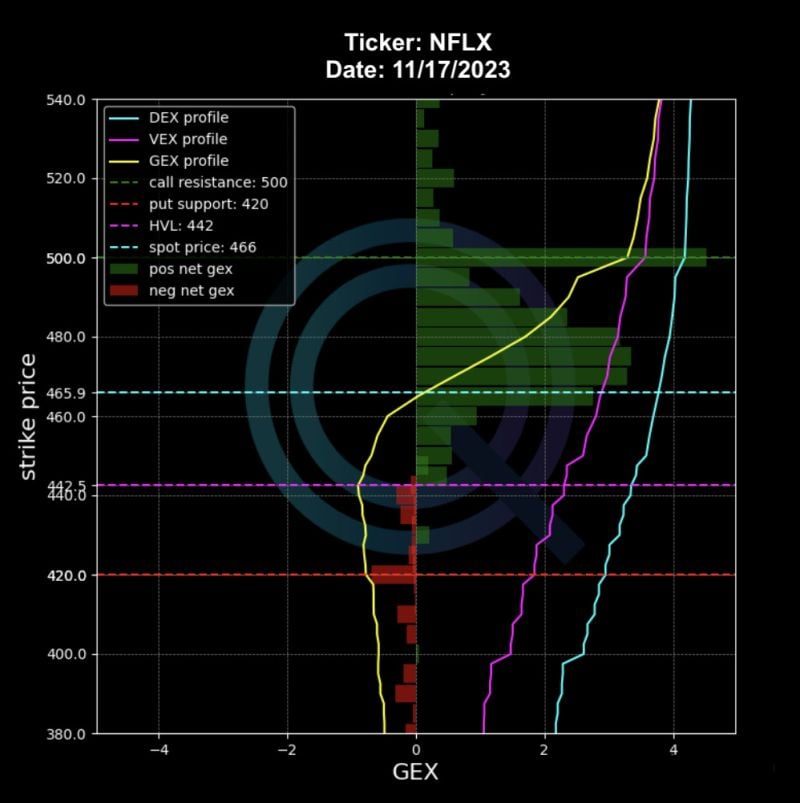
Net GEX Levels
Gamma Levels are Key Price Levels where there is more Negative or Positive Gamma based on market positioning and open interest. By looking at the options data we can define sticky price levels that can help us define our trading plan.
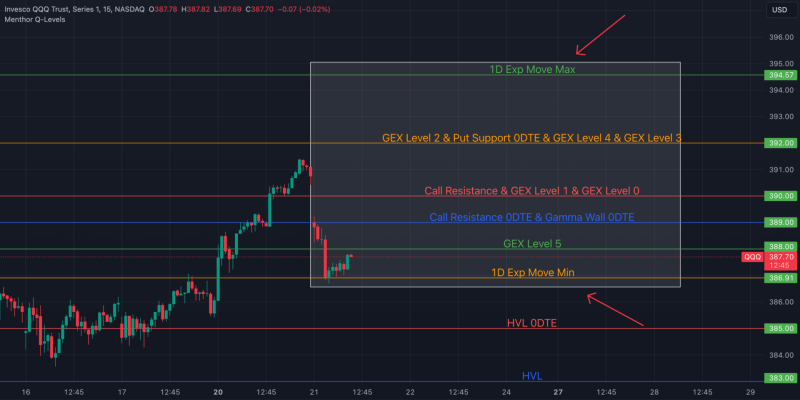
1D Expected Move Indicator
Leverage the Menthor Q 1D Expected Move Indicator. It takes forward implied volatility and helps us project possible future movements. It creates a daily range that can be used to set up our strategy.
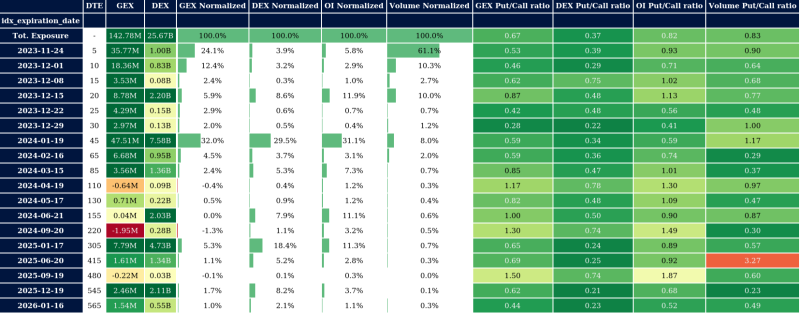
Options Greeks
Understanding the different Greeks is key to managing the risk of our position. The Option Matrix provides you access with relevant information across the option on Greeks, Open Interest and relevant ratios.
Your trading strategy?
