Gamma Levels on Futures Options
Menthor Q is excited to provide Gamma and Liquidity Levels on Futures Options.
We have created a dedicated Guide on Futures Options.
- Futures Options allows investors more flexibility as well as allowing better risk management.
- Futures also have their own options chain compared to the spot or index asset. For example we can use SPX Options as well as ES Future Options.
- While traditional Options gives you the exposure to 100 shares of the underlying, Futures Options gives the exposure to 1 Future Contract.
What Market or Futures does Menthor Q cover?
We are going to cover the following Markets and Futures:
- Index Futures: S&P 500 (ES), Nasdaq (NQ), Russell 2000 (RTY)
- Energy: Crude Oil (CL), Natural Gas (NG)
- Metals: Gold (GC), Silver (SI), Platinum (PL), Copper (HG)
- Rates: 2Y Treasury (ZT), 5Y Treasury (ZF), 10Y Treasury (ZN), 30 Treasury (ZB)
- Forex: EUR (6E), AUD (6A), GBP (6B), JPY (6J), CAD (6C), CHF (6S)
- Soft Commodities: Corn (ZC), Wheat (ZW), Soybean (ZS)
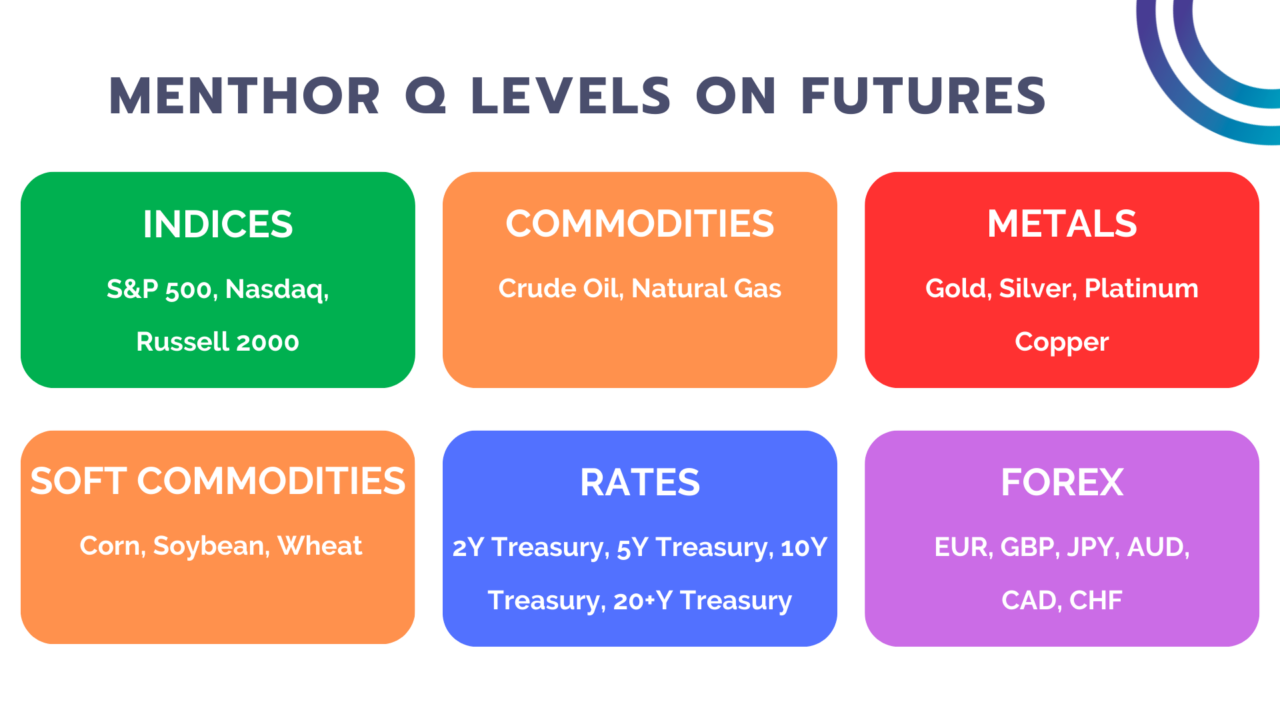
Here you can find our Excel File with the list of Futures Tickers available and our Coverage.
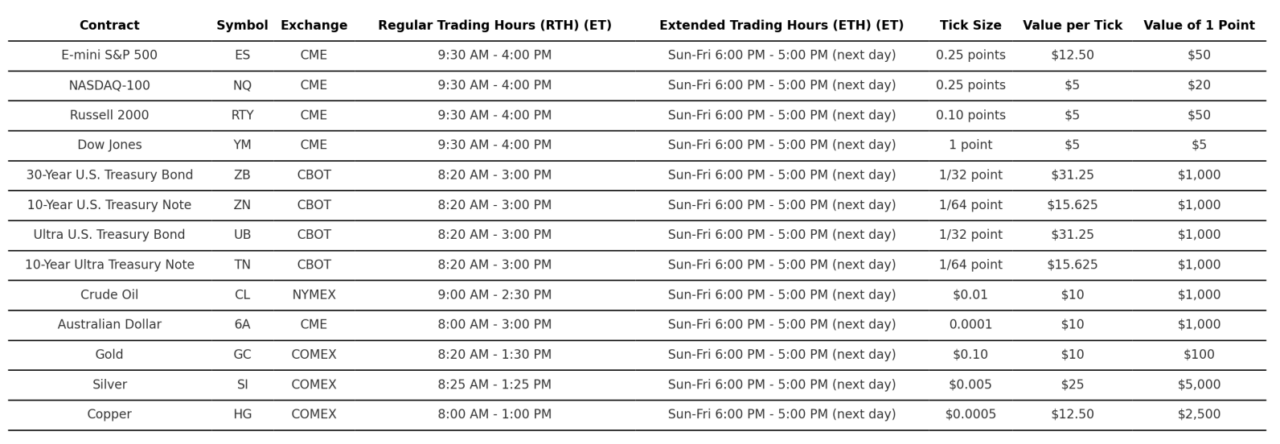
Futures Contract Cheatsheet
Here is a summary of each futures contract and their contract value.
Ticker Convention for Futures
A futures ticker symbol is a unique series of letters and, in some cases, numbers, representing a specific futures contract traded on a futures exchange. It is important to understand how a futures ticker works is crucial for traders and investors to track and trade futures contracts accurately.
Components of a Futures Ticker Symbol:
- Base Symbol: The first part of the ticker represents the underlying commodity or financial instrument. For example, “CL” stands for Crude Oil on the New York Mercantile Exchange (NYMEX), and “ES” represents the S&P 500 E-mini futures contracts on the Chicago Mercantile Exchange (CME).
- Expiration Month: Futures contracts have expiration dates, and each month is represented by a specific letter. For instance, “F” denotes January, “G” for February, “H” for March, and so on through the calendar year.
- Expiration Year: The last part of the ticker usually consists of one or more digits indicating the year of expiration. For example, “1” might represent 2021, “2” for 2022, etc. The format can vary between exchanges and can include the last one or two digits of the year.
Example of a Futures Ticker Symbol:
Let’s take for example the January Contract 2023 for Crude Oil. The ticker is CLF2023. This is how it can be composed:
- CL = Crude Oil
- F = January
- 2023 = 2023
Each calendar month expiration is identified by a single letter as follows:
- January – F
- February – G
- March – H
- April – J
- May – K
- June – M
- July – N
- August – Q
- September – U
- October – V
- November – X
- December – Z
How to request Futures Tickers via the Bot
Given our Integration with TradingView we are using the TradingView Ticker Convention. To request data on a Future you can do it in two ways:
- Generic. We can use the Generic Ticker. For example ES1! will represent the next expiration contract for ES. In the case of Russell we can use RTY1!, NQ1! for Nasdaq, CL1! for Crude. You can apply the same process for all futures.
- Contract Ticker. You can also use the contract ticker within the Bot. If you were looking for the June 2024 contract for Gold you could use GCM2024, if you wanted the July 2024 Contract for Crude you could use CLN2024. You can do the same for all other contract.
What Data can I access on Futures?
Within our Premium Membership you will be able to use our Discord Bots to query the data.
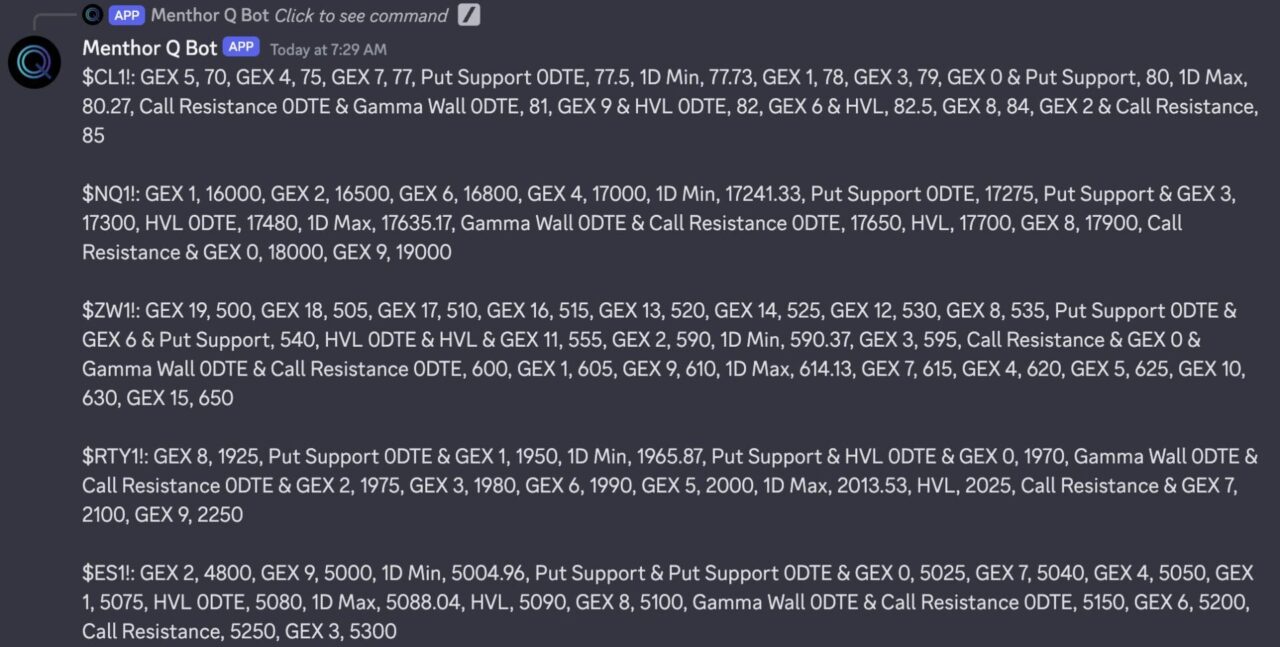
TradingView Levels
You can access Futures Gamma Levels directly into TradingView. First you can set up the Menthor Q Levels indicator.
You can use the /levels_tv command for single ticker levels or the tv_list for multiple ticker levels.
Net Gamma Exposure
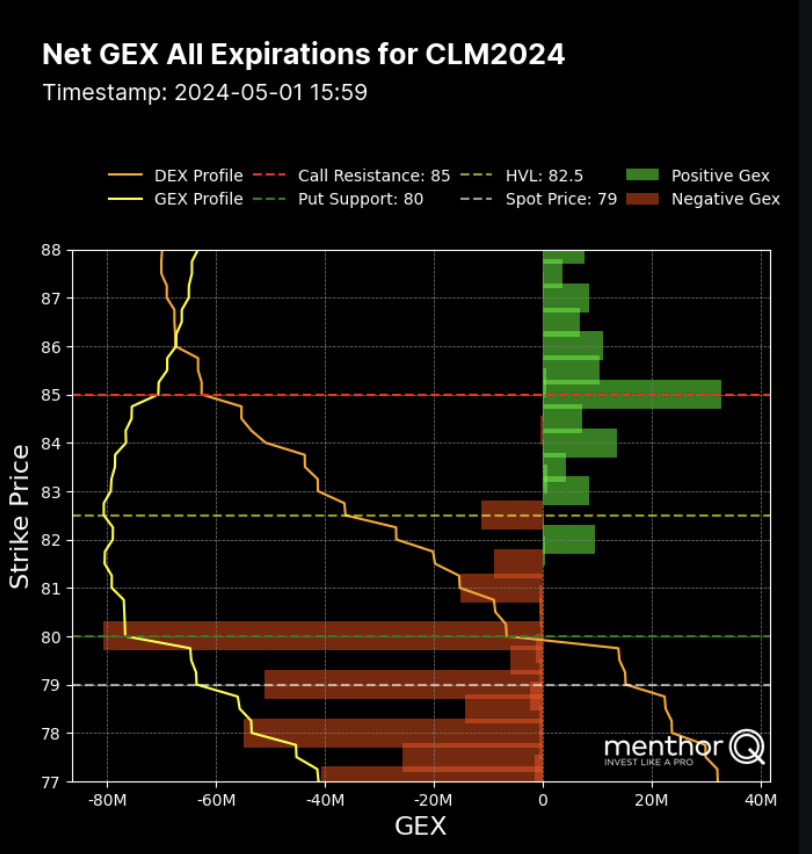
What this chart does is calculate the Overall Net Market Exposure on the asset by looking at the options data. It calculates if we are in positive or negative gamma and the gamma exposure at different strike prices.
We know that if there is a large gamma at a specific price this will represent a reaction zone if those levels are reached. This chart also allows us to understand if the sentiment is bullish or bearish on the asset.
Wide green bars represent a large options positioning on the calls and wide red bars indicate a large positioning on puts. We also want to monitor day by day the change in positioning and how these levels shift. To access this chart use the command: /netgex
Net Gamma Exposure Multi Expiration
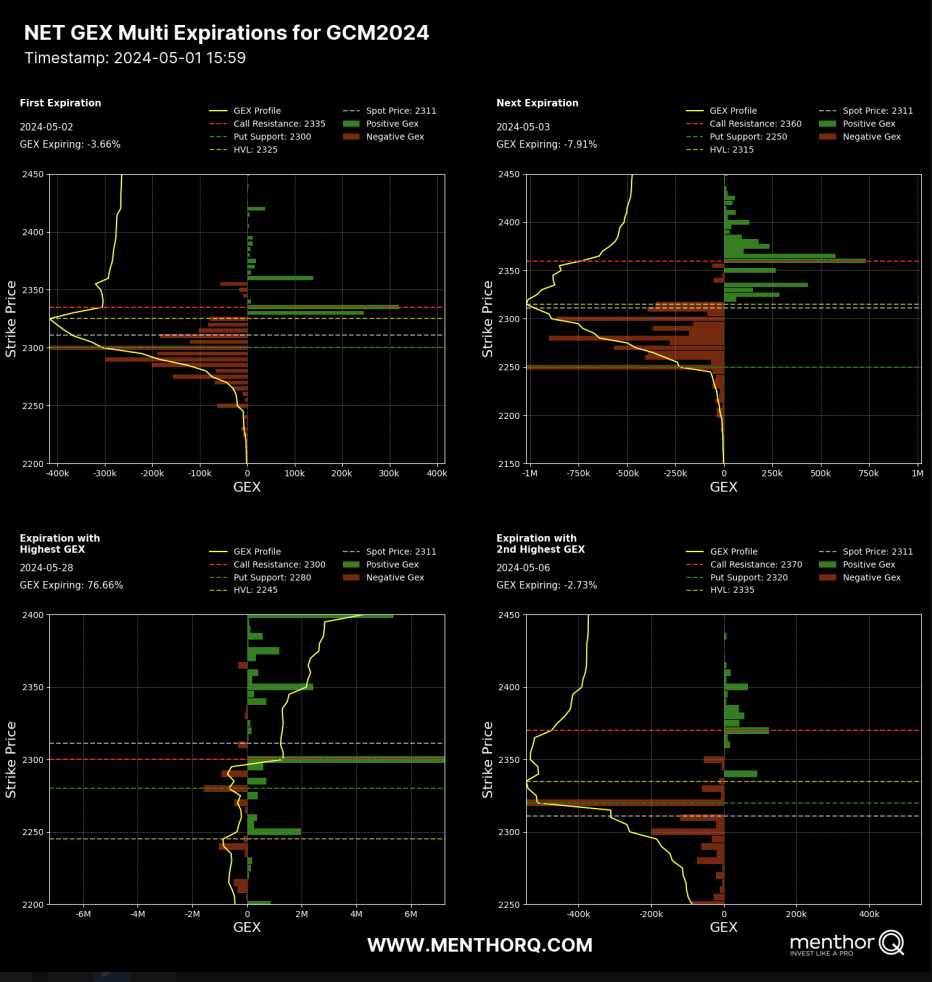
Similar to the previous chart we calculate Net Gamma Exposure for Multiple Expirations. Here you can find a grid with 4 charts:
- First Expiration
- Next Expiration
- Expirations with highest Net GEX. Here we want to look for the expiration with the highest concentration of Gamma
To access this chart use the command: /netgex_multiexpiry
Volume & Open Interest
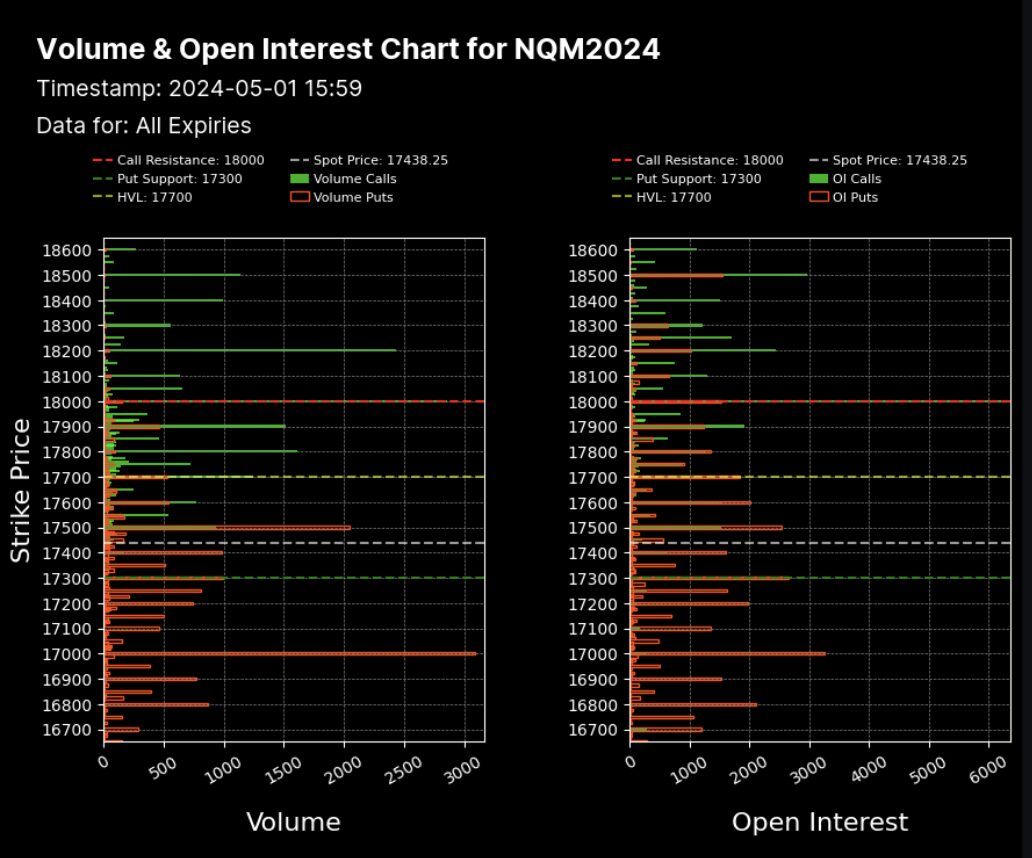
You can access the Command on Volume and Open Interest for the Asset. Here you can use the /voloi command for All Expirations or the /voloi_0dte for the next expiration.
Option Matrix
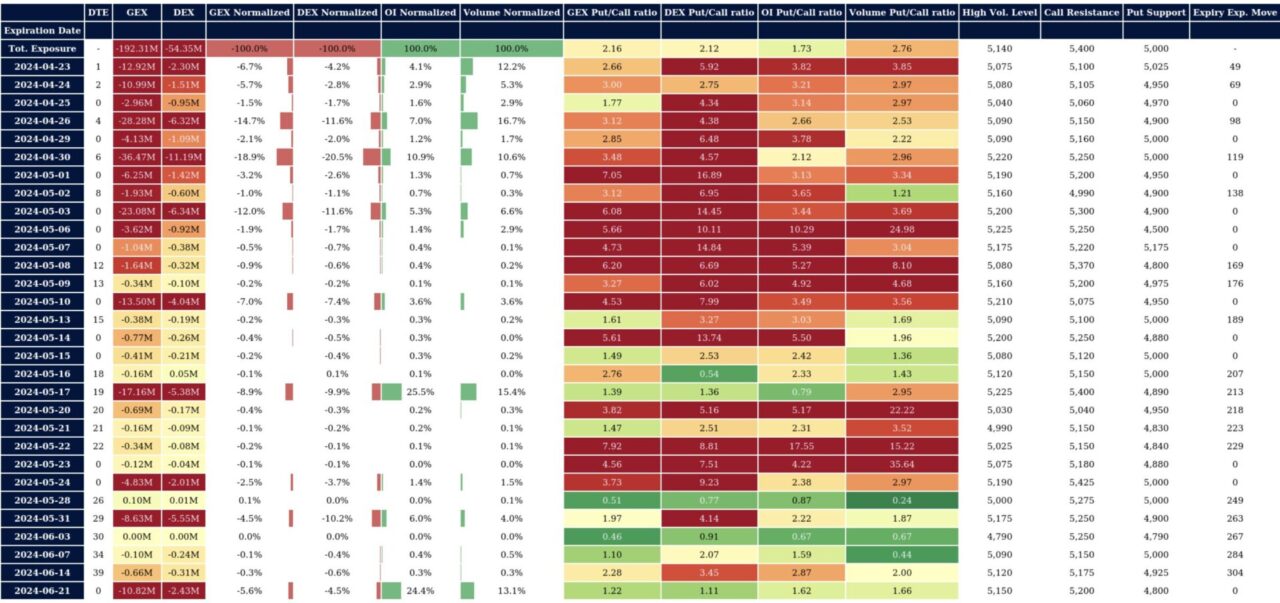
You can access the Menthor Q Option Matrix on Futures. We simplify the option chain and calculate the levels for every expiration in the future. Use the /matrix command to access it.
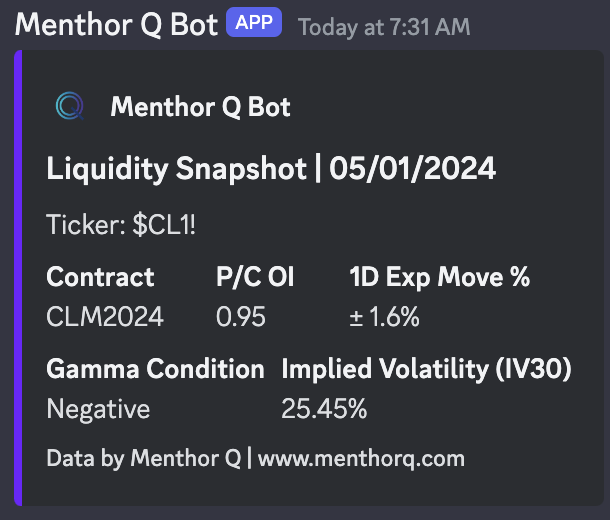
Liquidity Snapshot
To access Gamma Condition and Volatility of the asset you can use the /liq_snapshot command. This will allow you to understand if we are in Positive or Negative Gamma.
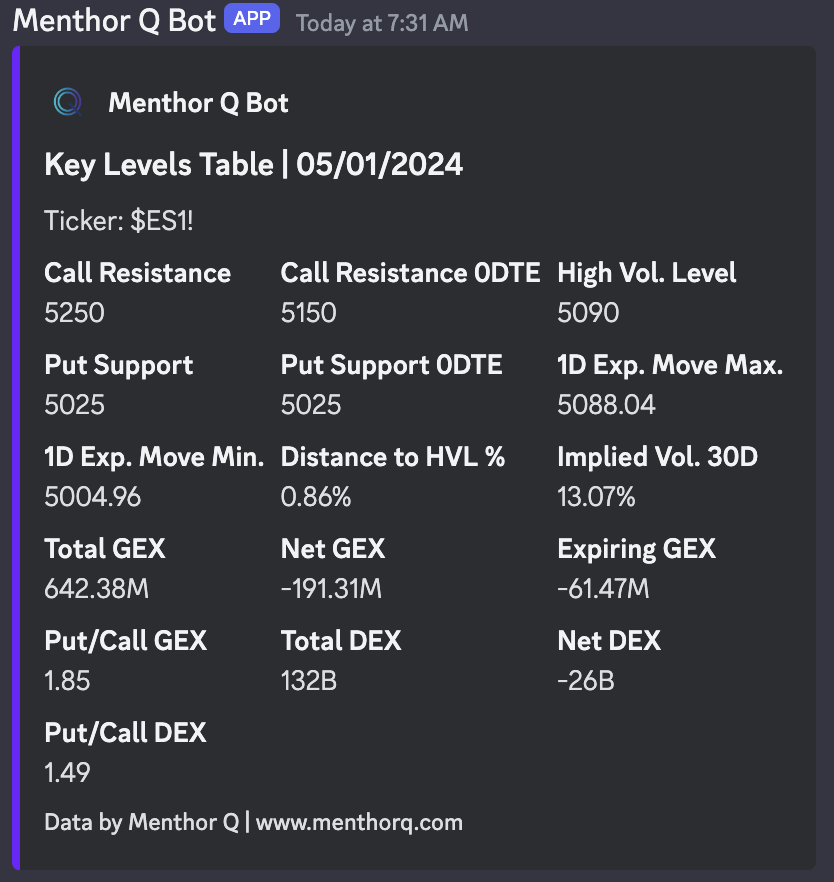
Key Levels Table
You can then access the Data via our Key Levels Table using the /key_levels command.
If you want to access Gamma Levels and Models on Futures join our Premium Membership.
