Gamma Levels on Futures Options: ES and NQ

At Menthor Q, we understand the complexities and rapid movements of the futures options market. That’s why we are excited to introduce our latest product development: Gamma and Liquidity Levels on Future Options.
But what are Gamma Levels?
They are Key Price Levels where there is more Negative or Positive Gamma based on market option positioning and open interest. By looking at the options data we can define sticky price levels that can help us define our trading plan.
Traders can see the depth of the market for futures options, helping them to make better trading decisions. We now offer these tools across multiple asset classes, including Indices, Commodities, Rates, and Forex.
Trading Examples on NQ and ES Futures
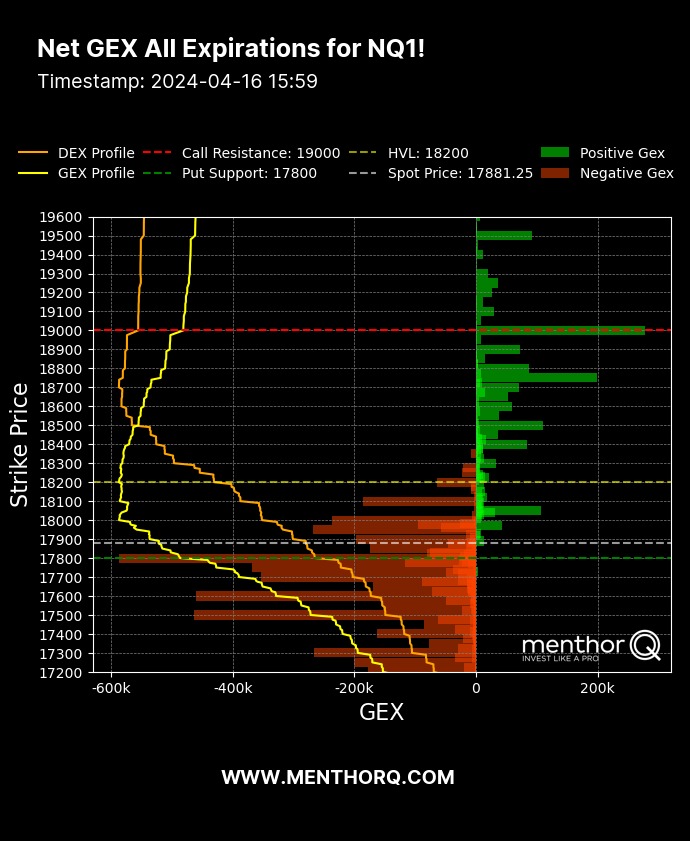
Now let’s look at some examples on using Gamma Levels on Futures. The first thing we want to look for is the Net Gamma Exposure or the Net GEX Chart. The chart below will show us the Gamma Exposure for all expirations. We want to understand Market Positioning and where Dealers might need to hedge their books.

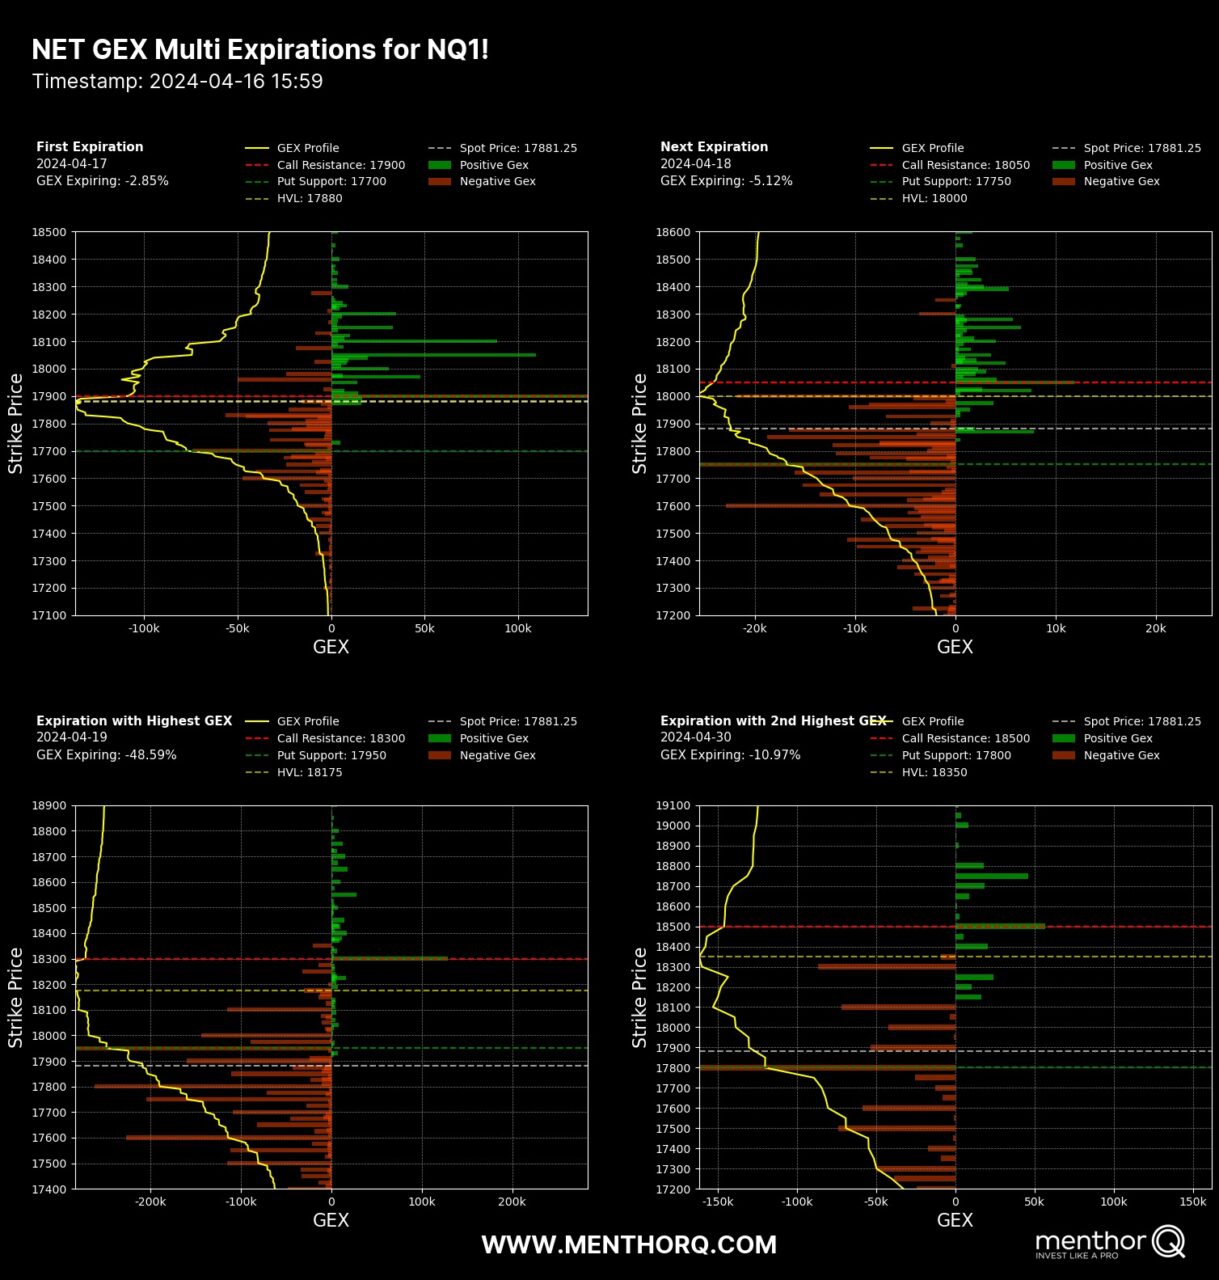
Then we want to look at the Net GEX Multi Expiry Chart. Here we can plot up to four expiration dates in the future. We want to look for 0DTE Flow, next expiration, and expirations with the Highest GEX.
This chart is key to help you understand market sentiment and exposure. We can also see the percentage of GEX expiring at each expiration date.

Once we understand positioning we can start plotting the levels on the chart. We can do this by leveraging the TradingView command within Discord.
For example on April 17th 2024 these were the levels for NQ and ES Futures by looking at their options chain.
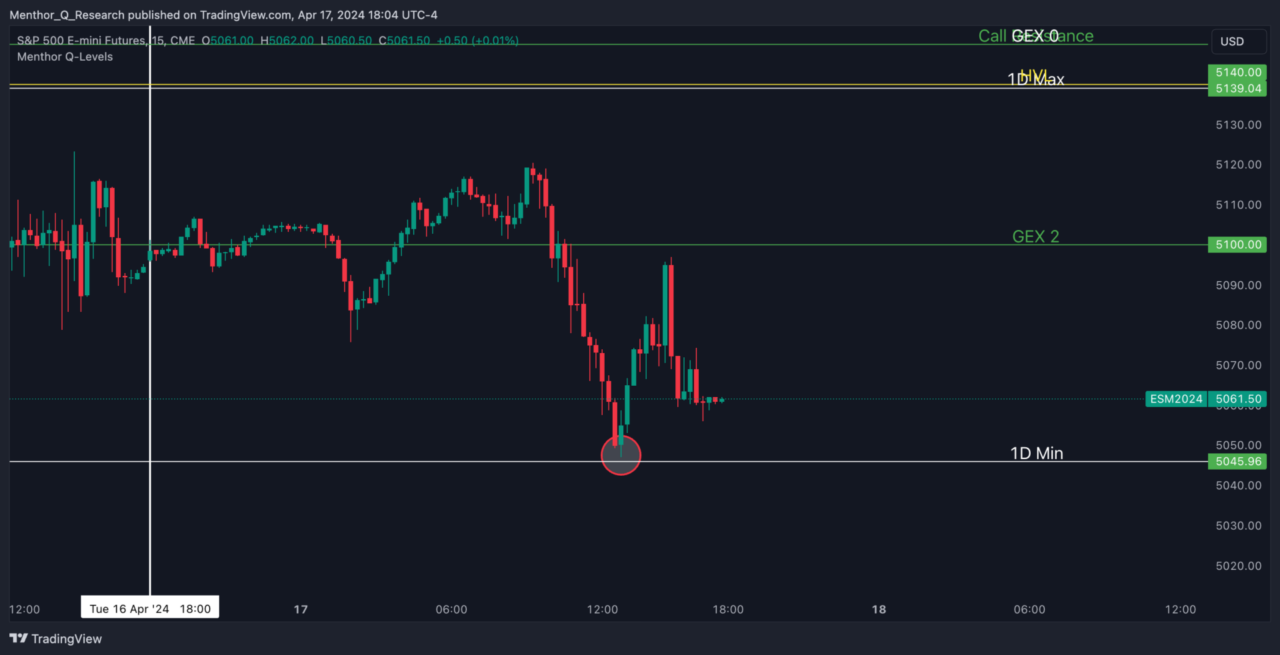
- $ES1!: Call Resistance, 5150, Put Support & Put Support 0DTE, 5000, HVL, 5140, 1D Max, 5139.04, 1D Min, 5045.96, Call Resistance 0DTE, 5200, HVL 0DTE, 5180, Gamma Wall 0DTE & GEX 4, 5200, GEX 0, 5150, GEX 1, 5400, GEX 2, 5100, GEX 3, 5420, GEX 5, 4800
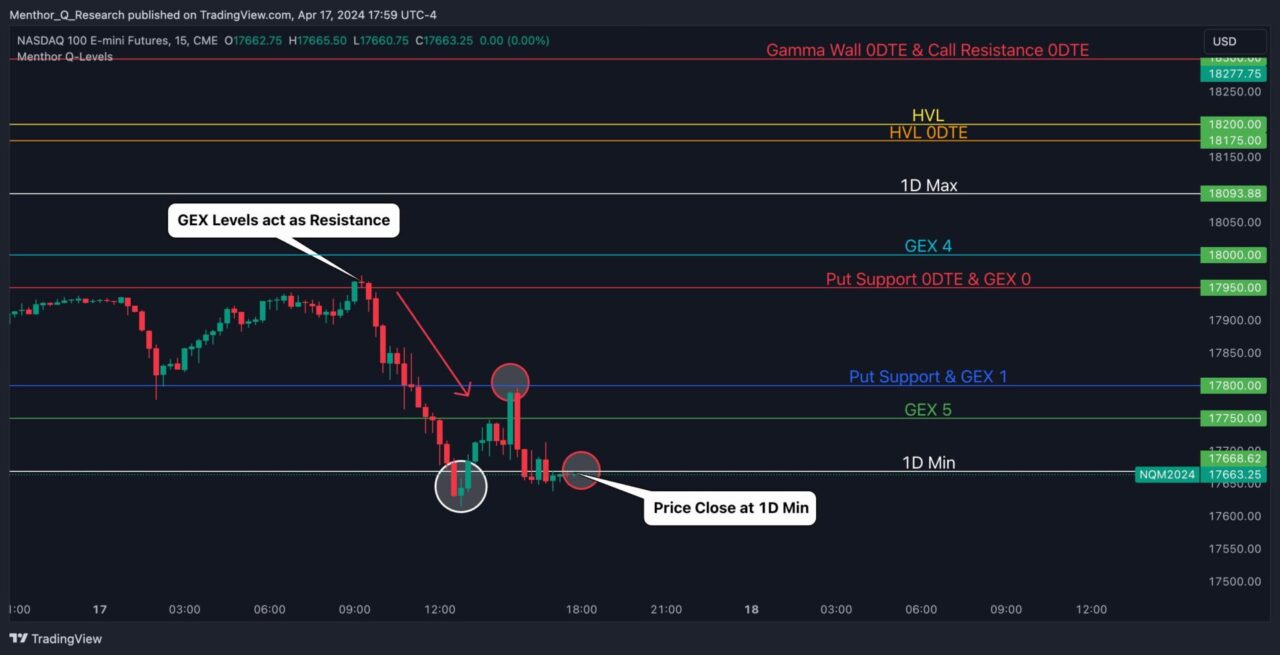
- $NQ1!: Call Resistance, 19000, Put Support & GEX 1, 17800, HVL, 18200, 1D Max, 18093.88, 1D Min, 17668.62, Gamma Wall 0DTE & Call Resistance 0DTE, 18300, Put Support 0DTE & GEX 0, 17950, HVL 0DTE, 18175, GEX 2, 19000, GEX 4, 18000, GEX 5, 17750
We can plot these levels by using the Menthor Q Levels Indicator for TradingView.
NQ (Nasdaq Future)
Now let’s start with NQ. In this chart we can see how the session opened. The GEX Levels acted as resistance and could provide a clear signal for a Short Trade.

Now that you are in your trade, how do you play this move? We saw a strong bearish momentum and the price moved lower towards the 1D Exp Move Min.
The price failed to break down and pulled back. The breakout from below to above the 1D Min could have provided a nice signal for a Long Trade. The price then reached the next levels and pulled back to continue its downward move closing right at the 1D Min for the day.
We can see from this example a clearer path for our trading plan.
ES (S&P 500 Future)
Now let’s do the same for ES.
The breakout of the GEX Level 2 could have provided a strong bearish signal. The price then has a strong momentum until it reaches the 1D Expected Move Min. This exact level stops the break and pushes the price higher to the GEX Level once again.

We will provide Futures Levels on the following Tickers going forward:
- Index Futures: ES – NQ – RTY – YM
- Commodities: CL – NG – HG
- Metals: GC – SI – PL
- Rates: ZN – ZF – ZT – ZB
- Forex: 6E – 6J – 6A – 6B – 6C – 6S
To access our Futures Data Subscribe to Premium.
