How to build a custom Option Chain Table in Thinkorswim

This document walks through the creation of a custom option chain table in Thinkorswim. The custom fields we will be adding are:
- OI Change – The change in OI from yesterday to today
- OI – Today’s OI (it matches the built in OI field, but combines the column w/ OI Change)
- OI% Change – The change in OI as a percentage
- Volume from Yesterday
- Volume from Today (it matches the build in Volume field, but combines the column w/ Yesterday’s volume)
- Volume % Change – Today’s volume, expressed as a percentage of yesterday’s volume. 100% = the same volume today as yesterday.
- Net Volume – A very rough, assumption heavy volume accumulator that attempts to show volume as a net positive (buying) or negative (selling). On uptick, volume is added. On downtick, volume is subtracted. The color represents the last uptick (green or red).
Step 1. Trade Tab
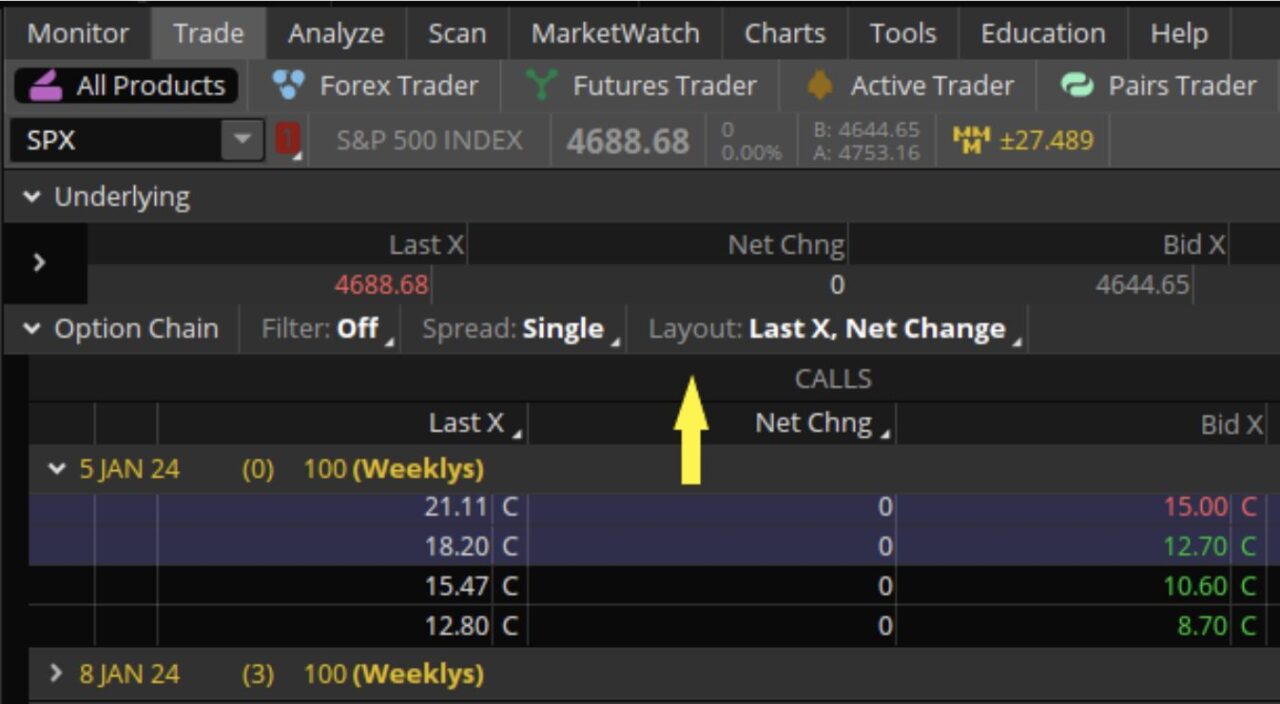
Go on the Trade Tab of your Thinkorswim platform and click on Layout.
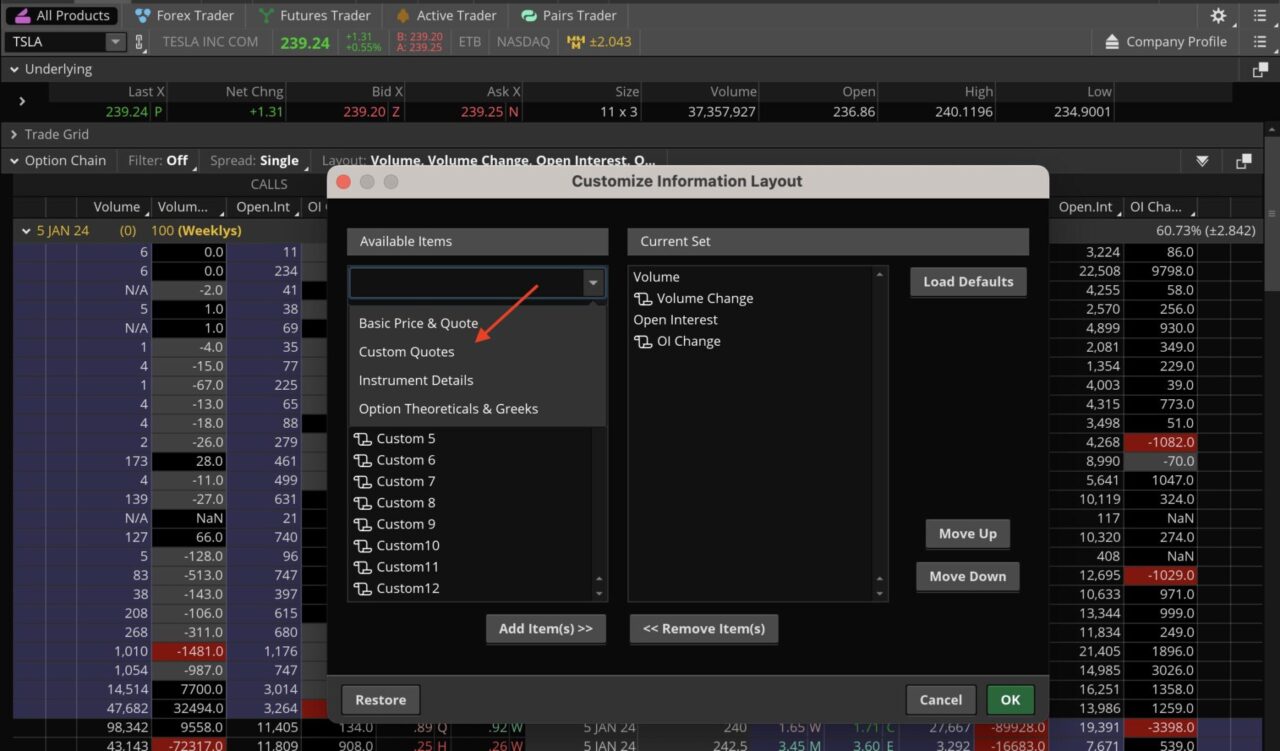
Then click on the Customize option and select Custom Quotes from the dropdown.
Step 2: Create Custom Fields
We will be changing 5 custom quotes. Start by clicking the icon next to any custom quote.
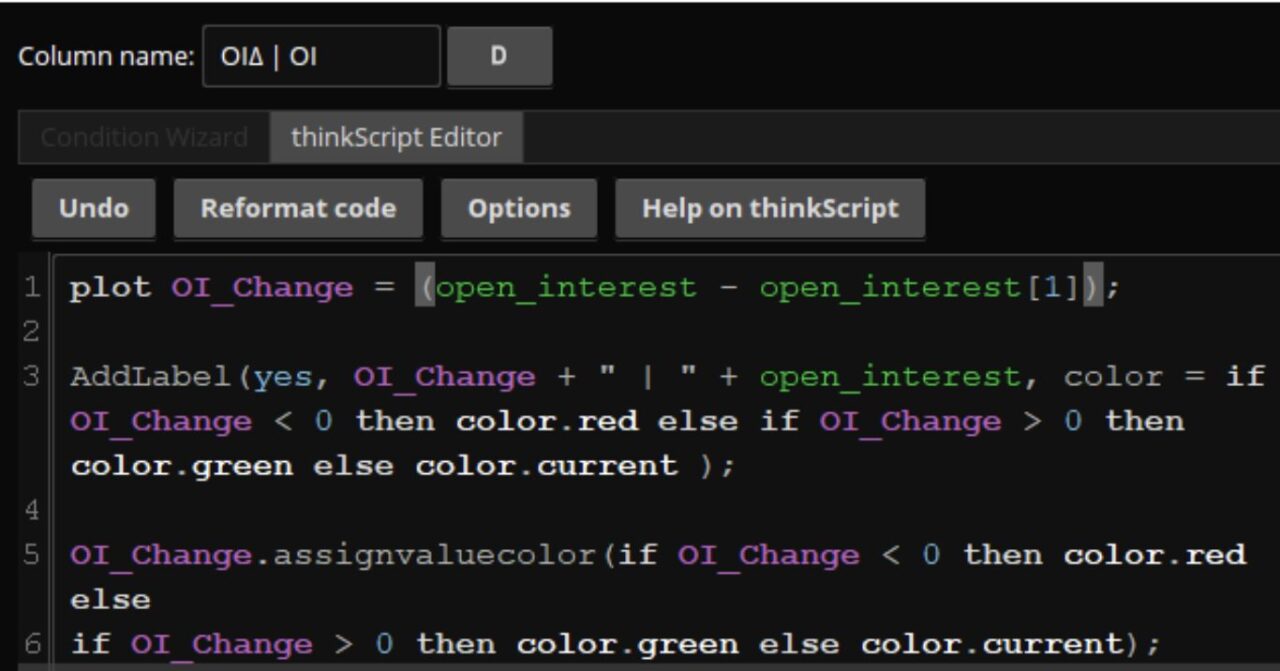
Here are the settings for the first custom quote.
- Update the column name
- Make sure the timeframe is set to DAILY (the D next to the name)
- Click thinkScript Editor
- Add the code
- Click OK
- The name of the custom field should now reflect the name you chose
Next we must repeat the process for the other 4 custom fields
Step 3: Custom Fields Code Script
Here you can access the scripts to copy and paste in the custom field section. Simply copy the script.
1. OI Change | OI Today (Daily timeframe)
Name: OIΔ | OI
Script:
plot OI_Change = (open_interest – open_interest[1]);
AddLabel(yes, OI_Change + ” | ” + open_interest, color = if OI_Change < 0 then color.red else if OI_Change > 0 then color.green else color.current );
OI_Change.assignvaluecolor(if OI_Change < 0 then color.red else
if OI_Change > 0 then color.green else color.current);
2. OI Percent Change (Daily timeframe)
Name: OI%Δ
Script:
plot OIPctChange = ((open_interest-open_interest[1])/open_interest[1]);
OIPctChange.assignvaluecolor(
if OIPctChange < -0.50 then Color.RED else
if OIPctChange < -0.25 then Color.ORANGE else
if OIPctChange > 0.50 then Color.GREEN else
if OIPctChange > 0.25 then Color.YELLOW else
color.current);
3. Volume Yesterday | Volume Today (1m timeframe w/ extended hours)
Name: Vu[1] | Vu
Script:
AddLabel(yes, TotalSum(volume()[1]) + ” | ” + volume(period = AggregationPeriod.DAY) );
4. Volume Percent Change (1m timeframe w/ extended hours)
Name: Vu%Δ
Script:
plot VoluPctChg = volume(period = AggregationPeriod.DAY)/TotalSum(volume()[1])*100;
VoluPctChg.assignvaluecolor(
if VoluPctChg < -100 then Color.RED else
if VoluPctChg < -50 then Color.ORANGE else
if VoluPctChg > 100 then Color.GREEN else
if VoluPctChg > 50 then Color.YELLOW else
color.current);
5. Net Volume (1m timeframe w/ extended hours)
Name: NetVu
Script:
def POSVU = if close() > close()[1] then volume else
if close() == close()[1] then roundup(volume/2, numberOfDigits = 0) else 0;
def UpVu = TotalSum(POSVU);
def NEGVU = if close() < close()[1] then volume else
if close() == close()[1] then rounddown(volume/2, numberOfDigits = 0) else 0;
def DnVu = TotalSum(NEGVU);
plot NetVu = UpVu – DnVu;
NetVu.assignValueColor(if NetVu > NetVu[1] then color.green else if NetVu < NetVu[1] then color.red else color.current);
Step 4: Ad your Custom Fields to your View
Now you can add those custom quote fields to your current view.
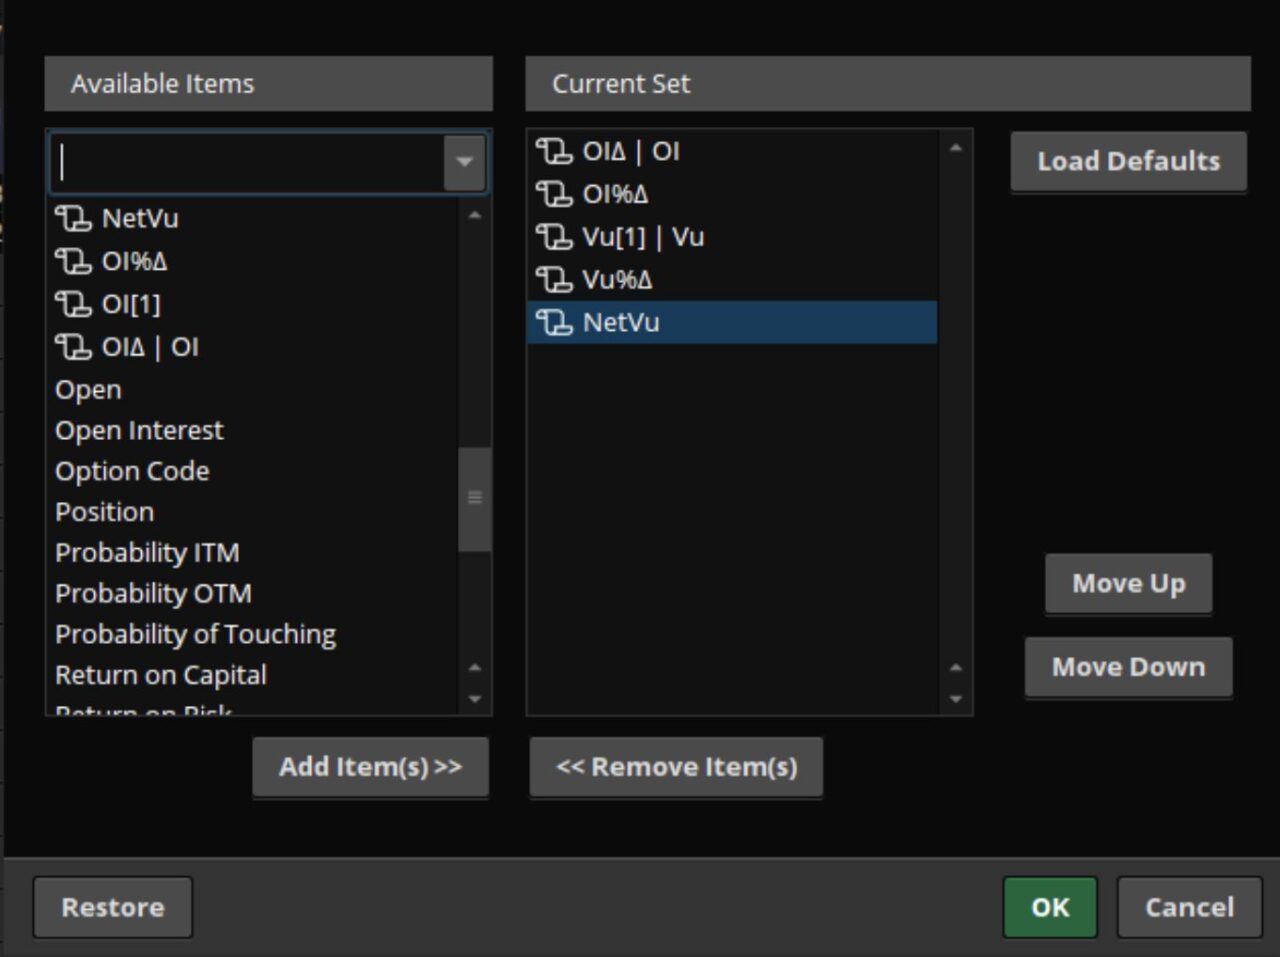
Now you will be able to see the fields in your View.
The last step is to save the layout for quick access in the future.
- Click the Layout drop down.
- Click Save As and either accept the default name or save it as a unique name.
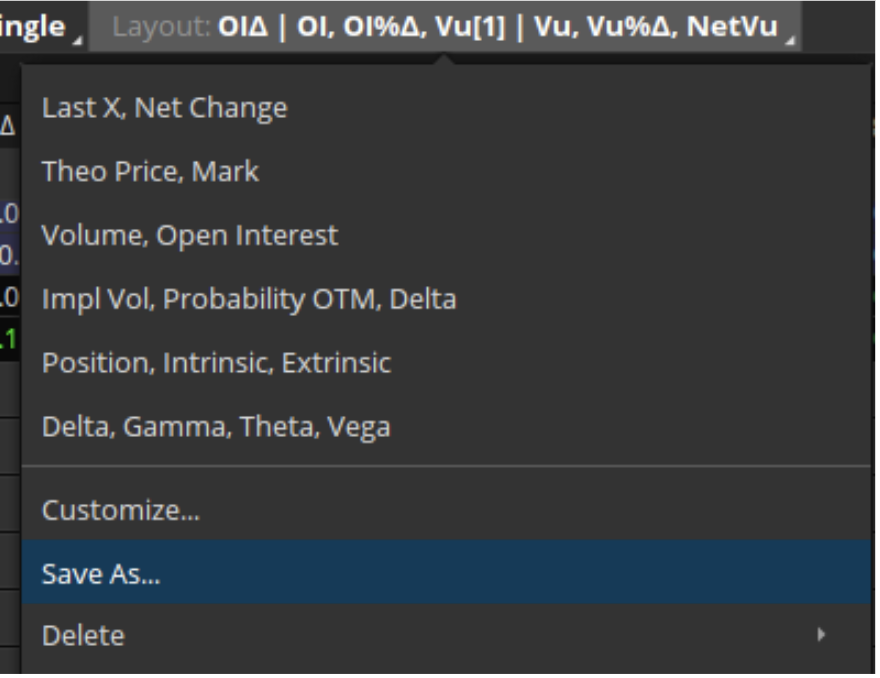
To access this view in the future, simply select it from the Layout drop down.
