How to manage risk during a market sell off

What happened on Wednesday the 20th of December, is a good reminder of what 0DTE and leverage in general can do to the market: raising intraday volatility.
This is the intraday chart of SPX for that day with our Key Levels.
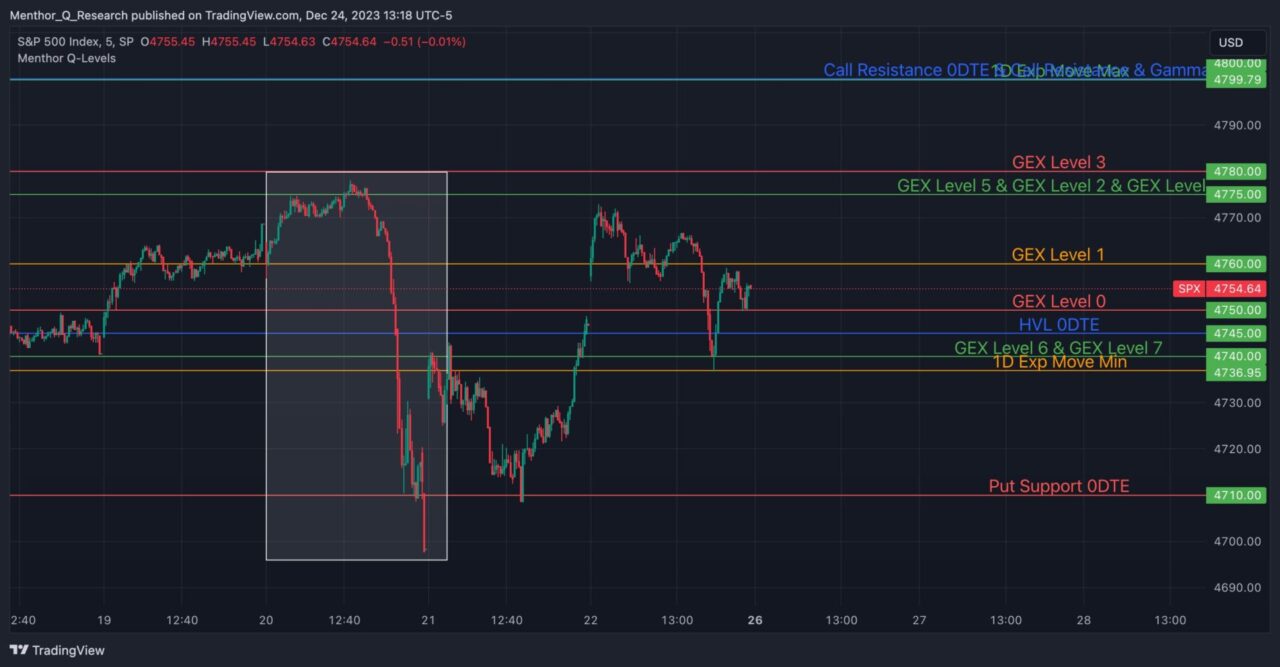
What did we know before the market opened and before the big drop?
Well we had seen an increase of the VVIX and VIX futures going up further out in the curve in 2024. So the truth? We knew that nothing pre-market predicted that drop. But let’s dig a bit deeper.
Low Liquidity
The market towards the end of December, trades on very low volatility. That means that market moves are accentuated, and volatility can be more impactful.
As JP Morgan had noted: “The average market depth in Dec is 8% ~19% lower than Nov between 13:00 and 14:30. The net selling imbalance of ES futures can be almost entirely explained by the delta imbalance on S&P 0DTE options. Our calculation based on tick level data reveals significant negative delta flow after noon/14:00 for both calls and puts. Gamma order flow was negative in the morning, but showed a positive flow for puts in the afternoon, indicating short covering. Interestingly, while the short puts were completely covered by the end of the day, calls continued to be sold through the sell-off”
The Sell Off
Most of the day there was little change in the market. The price action happened entirely by market close. The market dropped 1.5%, and we lost 4 days of gains. As we analyse flows, what we can really say is that, negative flows started in early afternoon, and we closed with net sale of $3.9B. Those ES flows are entirely related to delta (negative deltas) imbalances that were created by SPX 0DTEs. This is what GS had to say “while the short puts were completely covered by the end of the day, calls continued to be sold through the sell-off”.
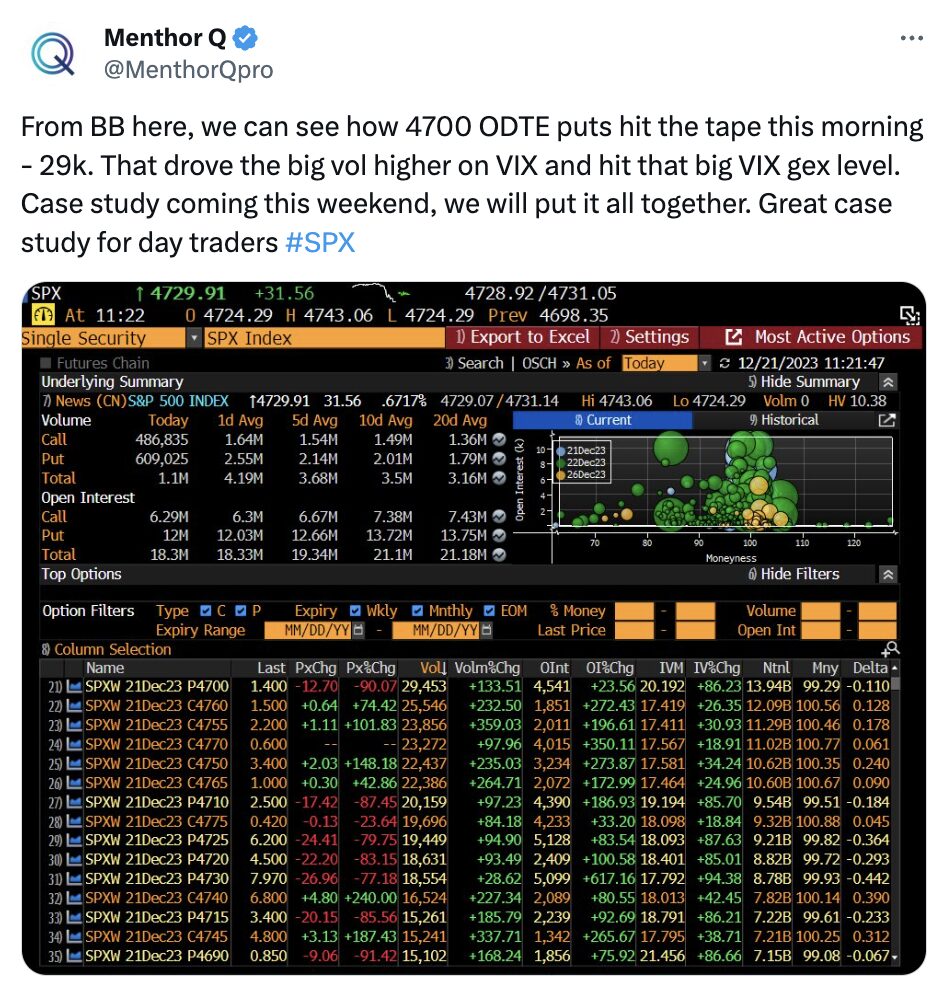
This is what we published on X at the end of the day. These were the 0DTE flows that we had seen.
These were the other notable short term option flow in the day:
- 12.5k SPX 4765,
- 7.5k SPX 4775.
These flows create big positive gamma, and large negative deltas that had to be covered by selling intraday on large down moves.
Could we have predicted this drop by looking at data?
The answer to that is no. It is unlikely that by looking at our data, or any other data you could have predicted this market move. Because models are just reactive to flows. So trying to monetize this type of move jumping in front of it, at least from our perspective would have not been possible.
But the second effect of that move was something we could have worked with. Because when such a big move happens, there is a big market and market maker’s re-positioning. Based on that new positioning, by looking at data and understanding delta hedging mechanics, we can increase our chances of success for our next trade.
Next Day assumptions based on the 20th market drop
Wednesday price action meant that dealers had to short ES futures to cover the OTM puts. We could see from positioning that most of those puts were short dated options. We could see this by looking at our multi maturity Net Gex. This is what we posted on X.
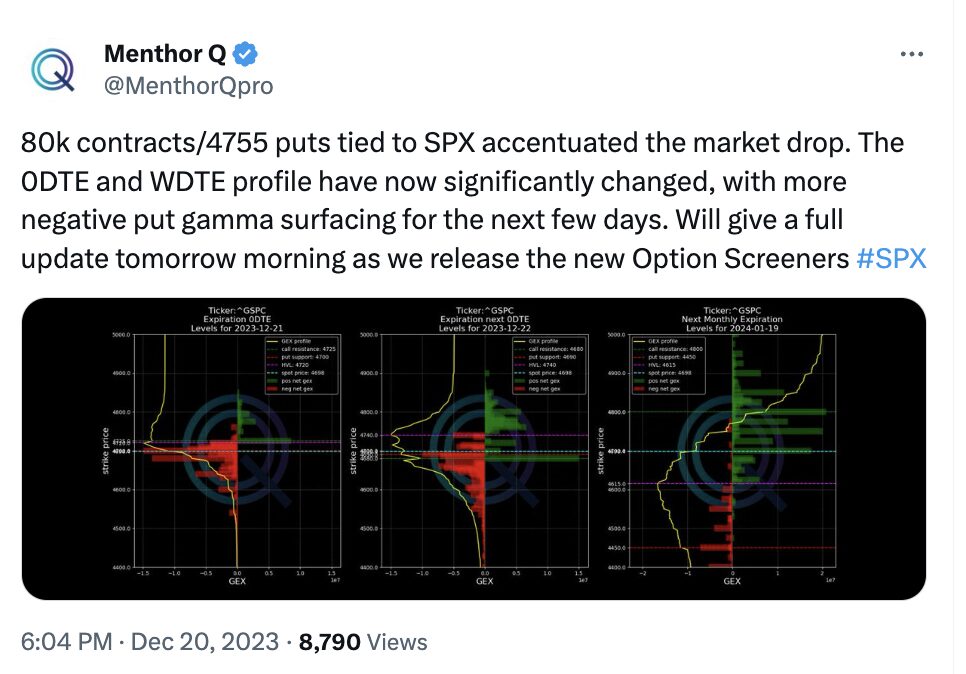
On the left of this chart you can see the 0DTE Net Gex, middle is weekly and monthly on the right. It was immediately clear that the Net Gex had shifted in short term maturities. In red you can see how the put gamma grew at the end of the day after the market drop.
What market dynamic could this positioning drive?
What we knew was that unless those options went ITM, Charm would have started to affect the value of those puts. In terms of market dynamics, that charm (decay in value) would have forced market makers to close the ES shorts driving the price higher.
Charm (Delta Decay) measures the rate of change of an option’s delta over time. We wrote an article on Put support and Charm. This can help you understand how the chart changes the value of the option and forces the market higher. We have an article dedicated to Option Expiration.
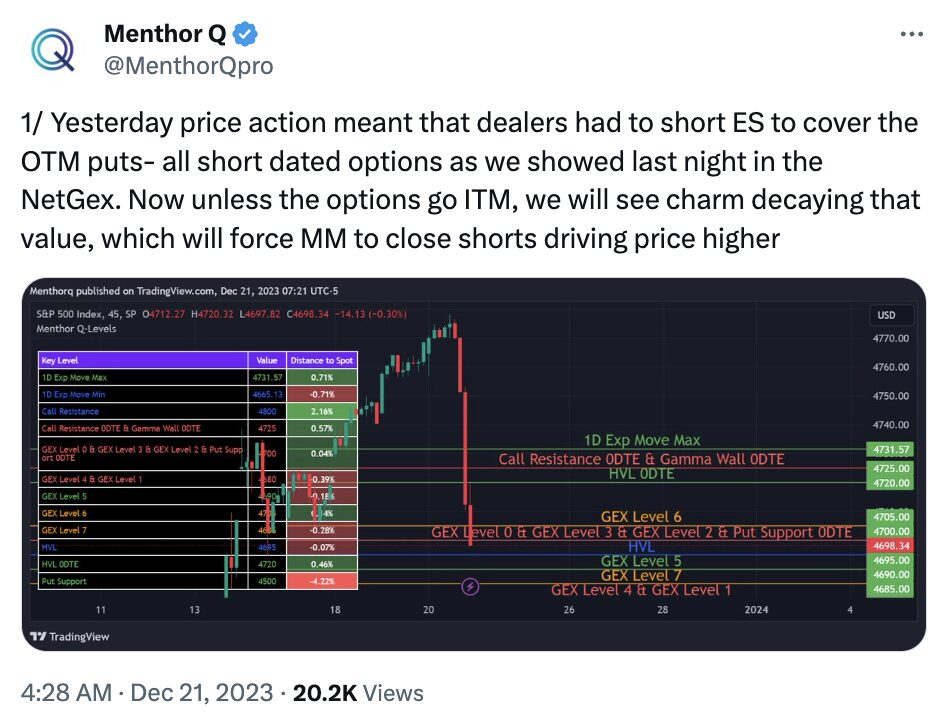
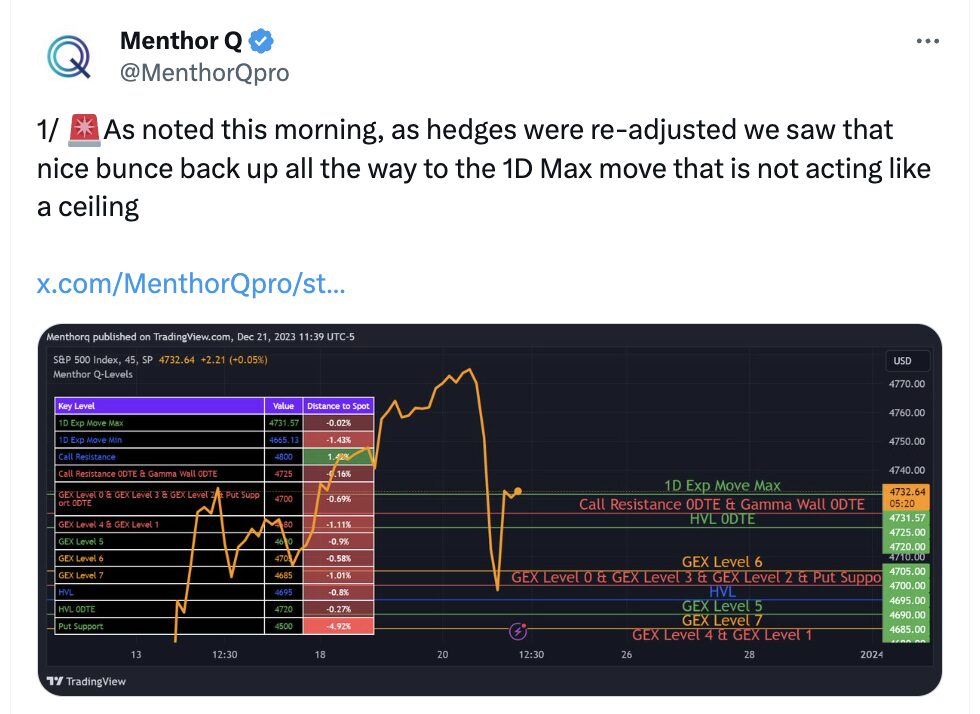
In this case, as we wrote on X, our assumption was that the market would have repositioned because of charm flows bringing the market back to our Call Resistance Level or the 1D Max Expected Move Level.
The re-adjustment
In that particular instance, the re-adjustment worked out as expected and the market bounced back. We had posted this on X to show that. Check out the X post.
Final thoughts
When the market is so one sided, you really have to keep a tight risk management. We had seen all technical indicators at extreme levels as we got into the move. But also all option data was clearly extreme to the upside. We were also in a time of the year when liquidity is very thin in the market. That can accentuate any market volatility. When big orders go in when there is low liquidity that accentuates market moves.
While it is hard to impossible for retail to read these types of moves, it is also for a lot of institutions. That was clear by most of the comments coming out of the institutional desk post market close. That is just markets for you.
As retail, we want to trade like institutions as close as possible with the data/tools that we have. Understanding data can help us manage risk, and increase our chances of success. We say chances, because none of the data out there can be 100% accurate. We have to be honest with that. What we do is dissect past data as much as possible, to be able to narrow the potential outcomes.
As Doc says in our Trade Structuring channel, this is a marathon, and not a 100m dash. You want to be able to make money everyday by keeping a tight risk management. While trading Wednesday’s 20th downward move was near to impossible, you could have risk managed it.
In 2024, we will continue to dissect data, and to build new models to help you stay safe in the markets.
