How to Trade 0DTE Levels

This week we will focus on models and price action. Let’s try to see some of the ways that you could have used our models. We will also try to see how we can combine the key option levels with momentum charts to get confirmation of what we are seeing in the option chain.
Sticky 0DTE Levels
Let’s start by looking at the last trading day of the week. The trading day is Friday 12th January 2024. What we noticed on Friday before open was that the SPX 0DTE had formed two very sticky strikes. That was very noticeable when we opened the Net GEX Chart for different expirations including 0DTE. If you do not know what Net GEX is please take a look at this article.
If we look at the left panel of this chart, we can see very clearly that there are two strikes that stick out as indicated by the arrows. The strikes we were looking are 4765 and 4780.
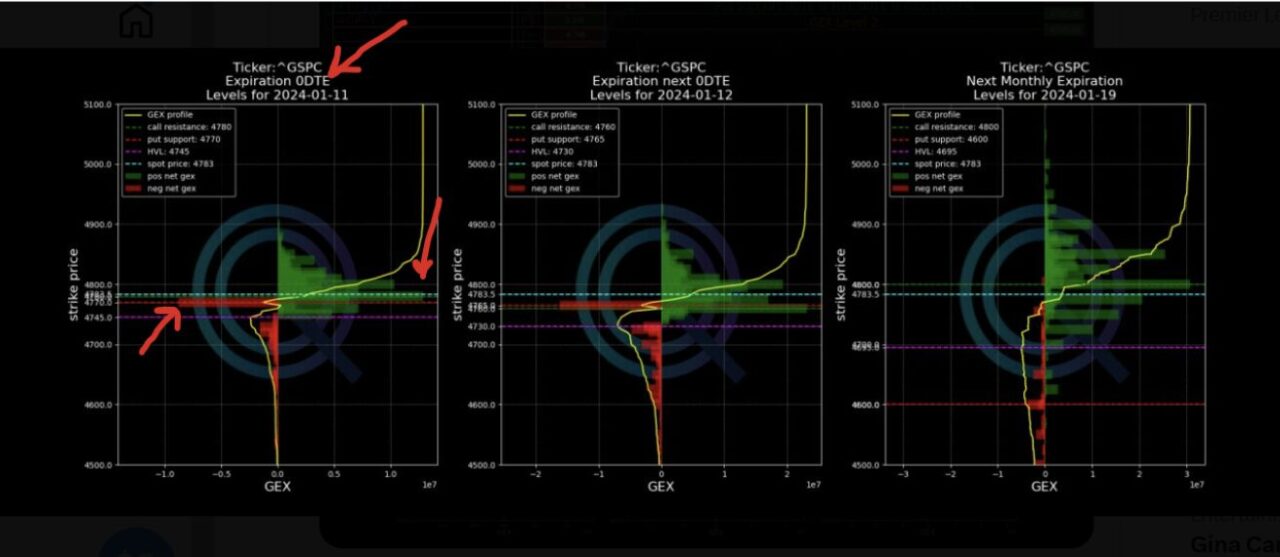
In general those sticky strikes can come at play during the day, potentially becoming support and resistance levels.
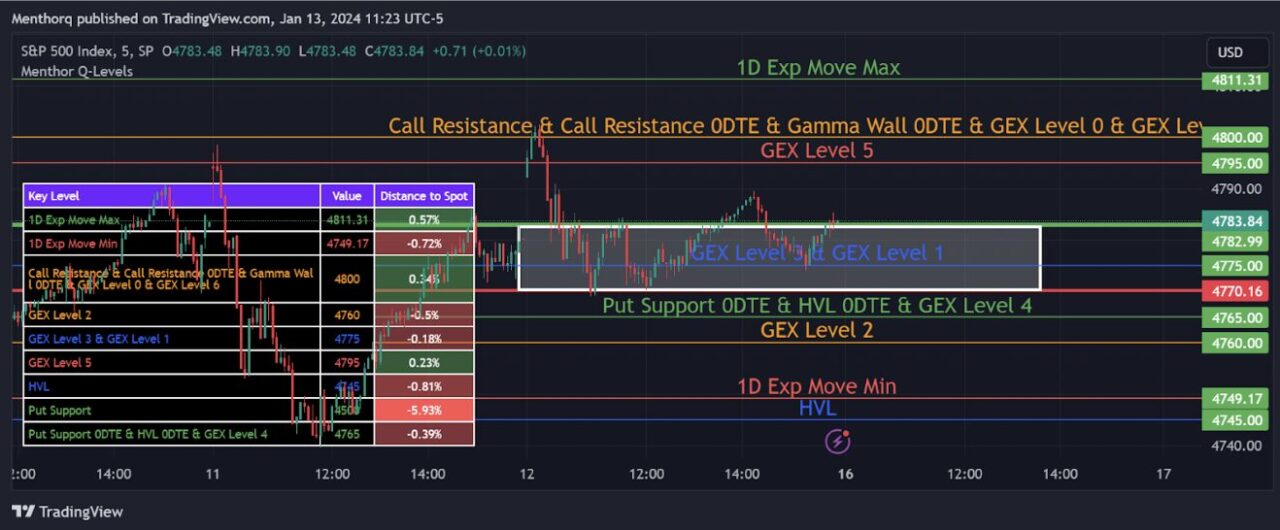
The next thing we could have done after reviewing the Net GEX could have been to plot the levels in TradingView. This is what we had posted before the market opened.
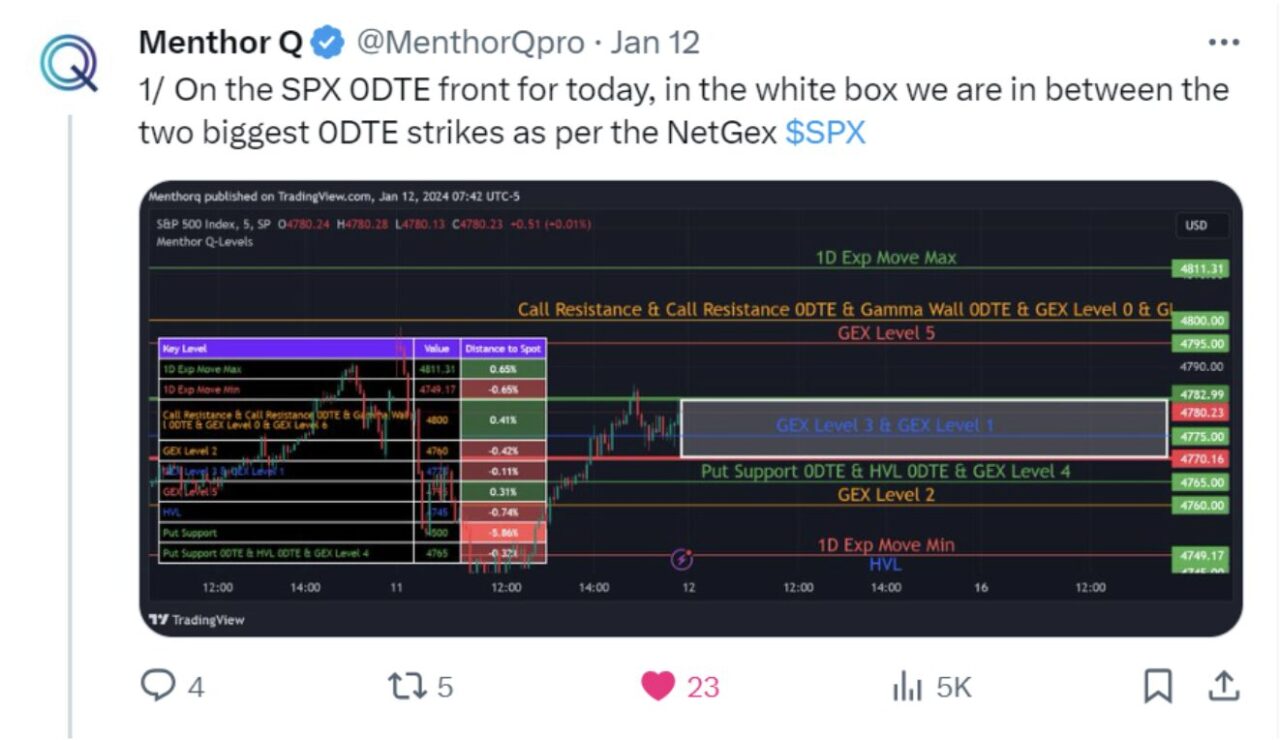
That white box was nothing more than the range between those two sticky 0DTE levels we saw in the Net GEX chart.
Open Interest and Volumes
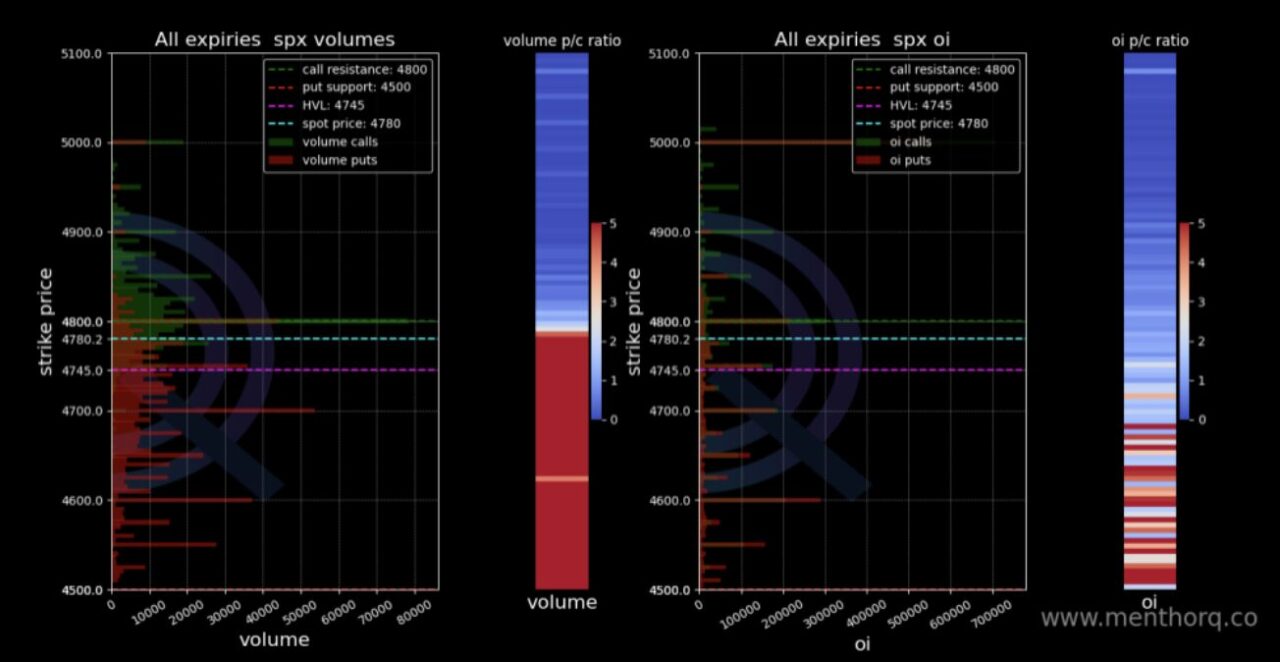
The next step would have been to look for Open Interes nodes around those sticky 0DTE levels. By looking at Open Interest and Volumes you want to see if there is the potential for strikes above or below that box that can become a potential key level during the trading day.
You want to be able to see where Open Interest / Volumes are concentrated. The chart would have confirmed what we were seeing in the other charts, that concentration around the 0DTE strikes.
What was Momentum telling us?
Finally, we integrated technical analysis in our study to get further confirmation of what we were seeing in the option chain. To do that we used the Menthor Q Momentum indicator in TradingView. The indicator in this case confirmed that the 0DTE support of our box was confirmed.
By leveraging the Support and Resistance and the Volume Profile we can see a Volume Support at 4765.
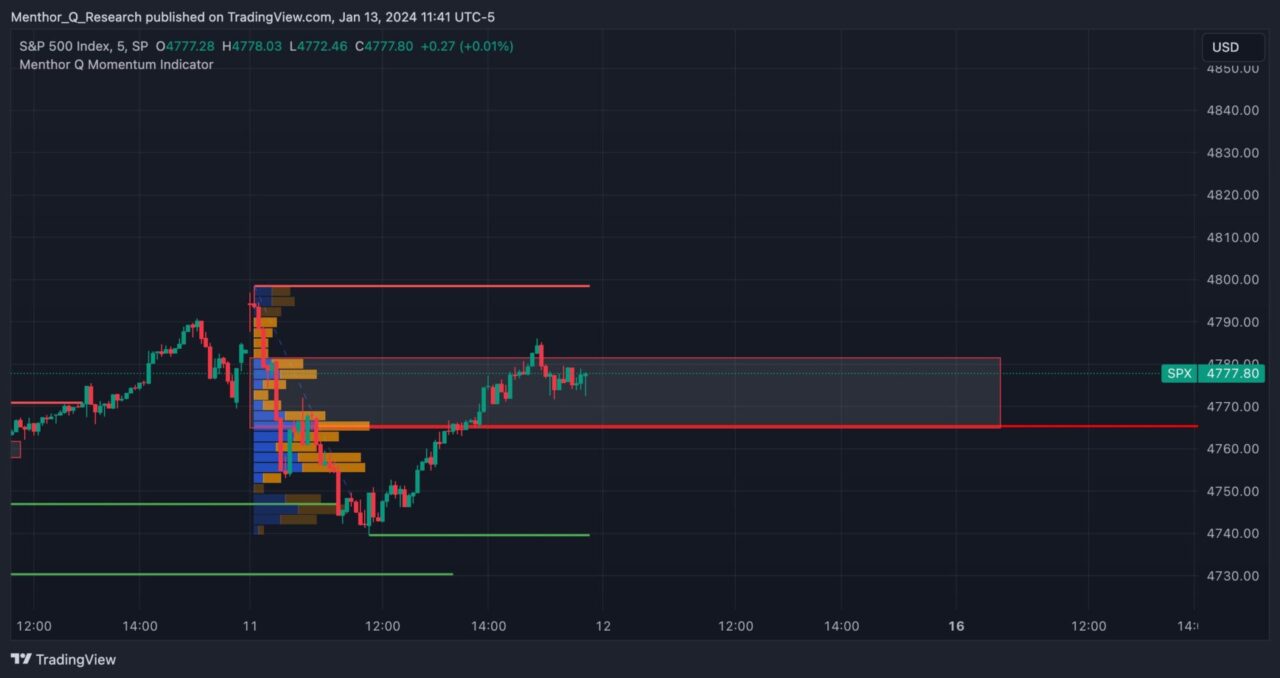
Ultimately the price action worked out pretty well during the day, as we can see, the price moved right around those two levels in that white box. An options Spread Trading Strategy could have been set up around those levels.
If you want to access all our Data, Levels and Models join our Premium Membership.
