How to use Technical Analysis with Options Data

Today we are going to go through an interesting case study on How to combine Options Data and Gamma Levels with Technical Analysis.
We receive a lot of questions from our community asking on how to use our data and these are some common concerns:
- I only trade equities and futures and find options too complicated.
- I find options risky but I would still want to learn how to use them.
- I think there is a lot of value from the options market but don’t know how to read your data.
Let’s try and answer these concerns and let’s look at a practical example. But first why do we look at Options?
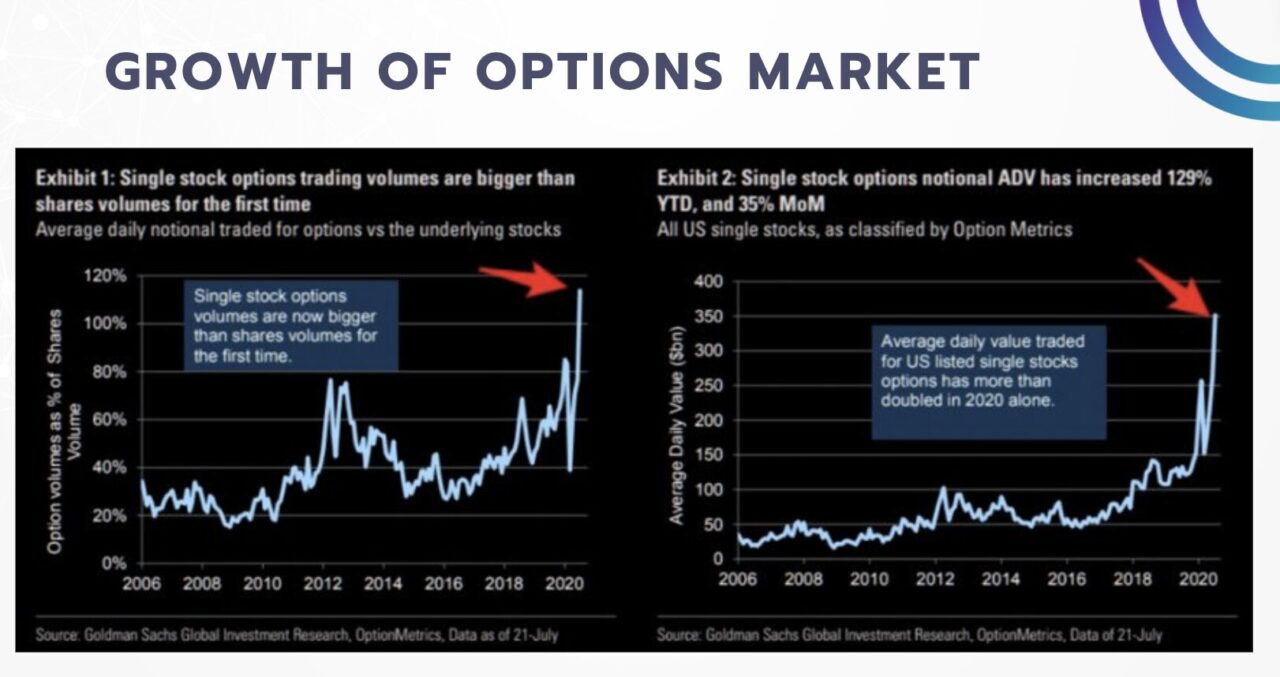
The answer is very clear. As we can see from the slide below Options Volume have increased and will continue to do so. In 2021 Options Volumes surpassed Equity Volumes for the first time.
How to change your strategy when the market changes?
If you trade any asset whether is a Stock, ETF, Index or Future you cannot ignore the importance of Options and the information contained in this market.
You do not need to trade options but it is key that you understand how the market structure changes based on the change in market positioning and the best way to see this is by looking at the options data.
Options data is expensive, it is a large dataset and it is complicated. That is why many investors avoid it and miss out on the opportunities. And that is why Menthor Q is here.
Case Study: How to trade the NQ Future using Options Data and Gamma Levels
Now last week was an interesting one. On Thursday we saw a market downturn and the Nasdaq closed down -1.55% pushed by the geopolitical tension and the words from the Fed about interest rate cuts in 2024. The market saw one of the worst days of 2024.
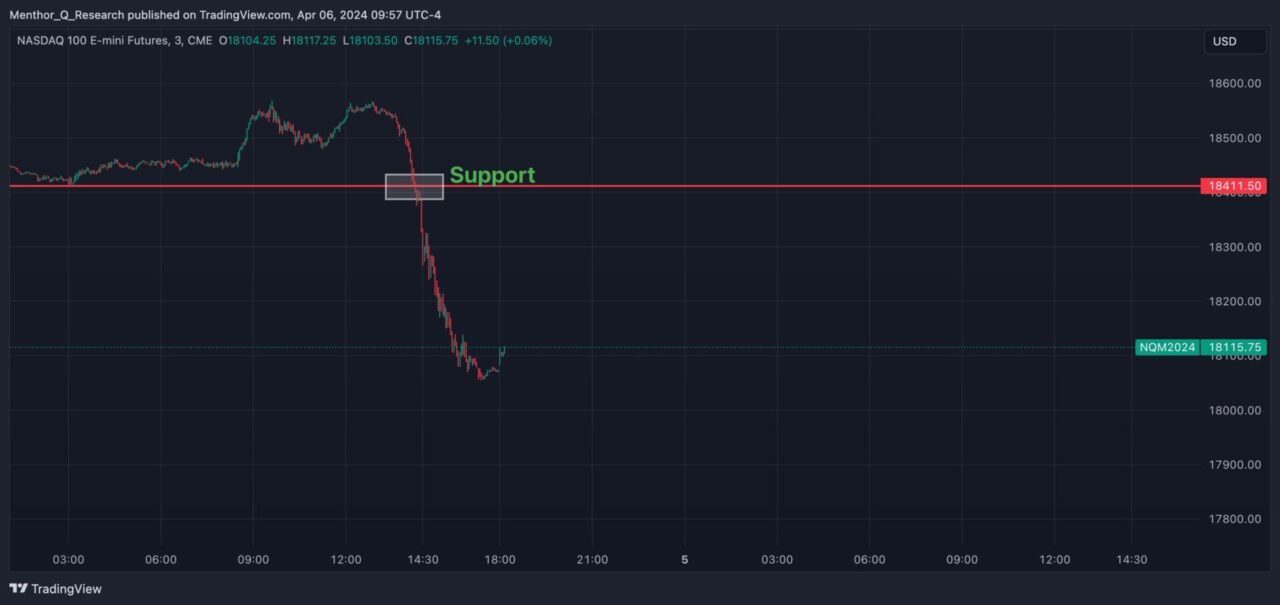
Now let’s look at the chart of the NQ Future after the close on Thursday. From a Technical standpoint we see a breakout of a Support Area that pushes the price down on a bearish trend.
Now let’s look at the change in positioning from the Options Data. You can access these charts within our Premium Membership after the close.
We can see that there is a big shift in bearish positioning. On the left we have the Net GEX Chart of Wednesday Close and on the right the Net GEX Chart of Thursday Close.
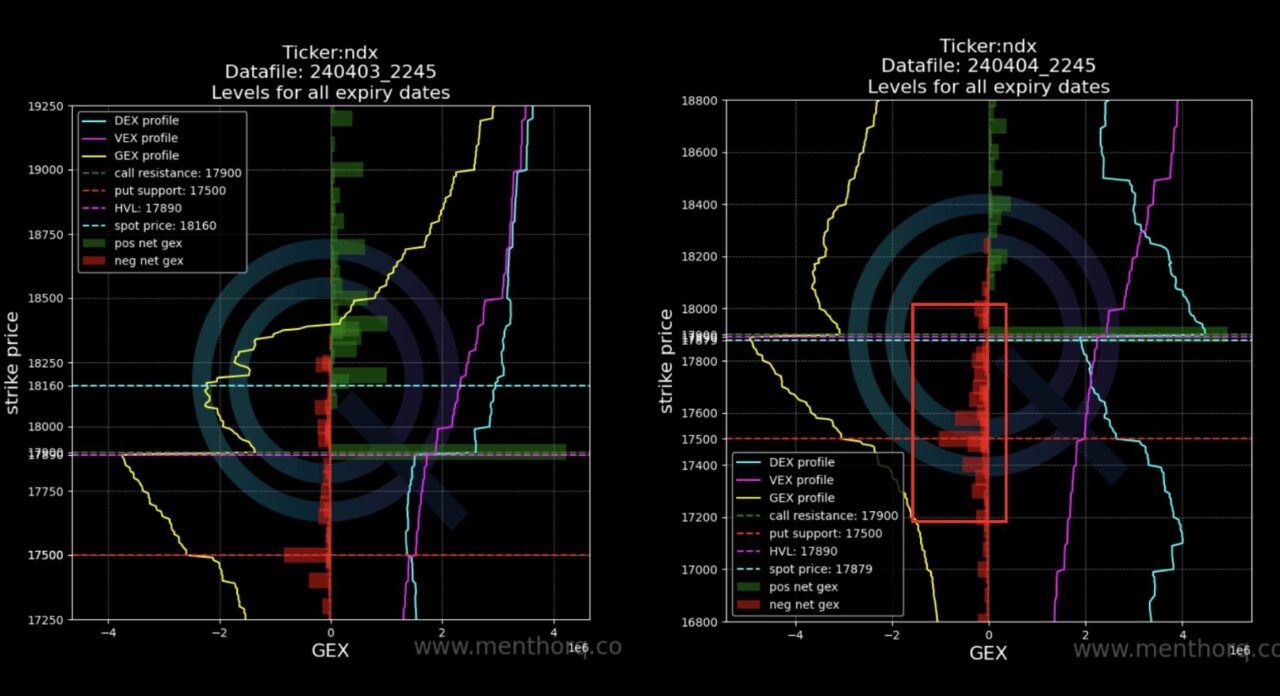
This chart also shows us the Primary Levels: Call Resistance, Put Support and High Vol Level. Below you can access our Guides that show you how to use each of them.
How did the market react?
Now on Friday the market was waiting for very important data: the Non Farm Payroll and the Unemployment Rate.
So how could you get any signals from this event and this chart? This chart alone can be a difficult one but now let’s overlay it with the Menthor Q Levels Indicator.
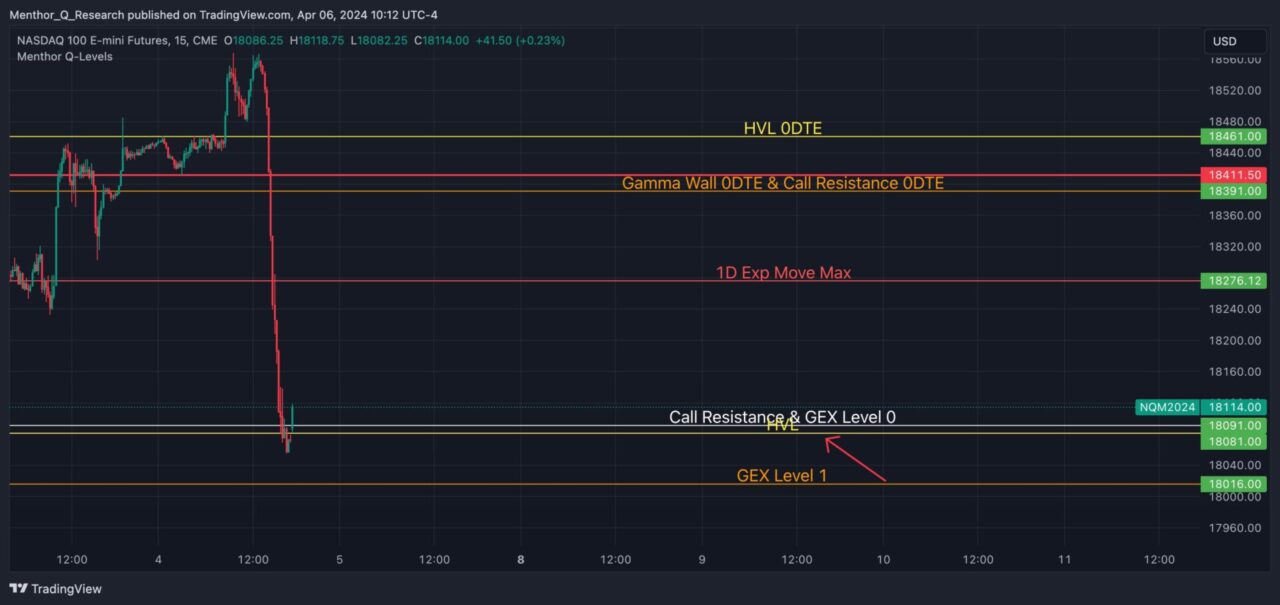
We want to observe that Yellow Level which is the High Vol Level. The High Vol Level in layman’s term signals the shift between Positive and Negative Gamma. We have written an article about it.
When the market shifts we typically can expect more volatile movement given by the way Market Makers need to hedge in Negative Gamma.
Now let’s look at the price action from the next morning. The price moves around that HVL Level and in the morning we see a pullback to the level that could have given us a nice BUY Signal.
The next level we want to monitor is the 1D Max. You can read more about it here.
A break of this level typically brings a strong momentum giving us another potential BUY Singal.
When the market exceeds this level it becomes overstretched and a pullback is very possible.
The price pushes up to our previous Resistance Level which is very close to our Gamma Wall 0DTE and Call Resistance 0DTE.
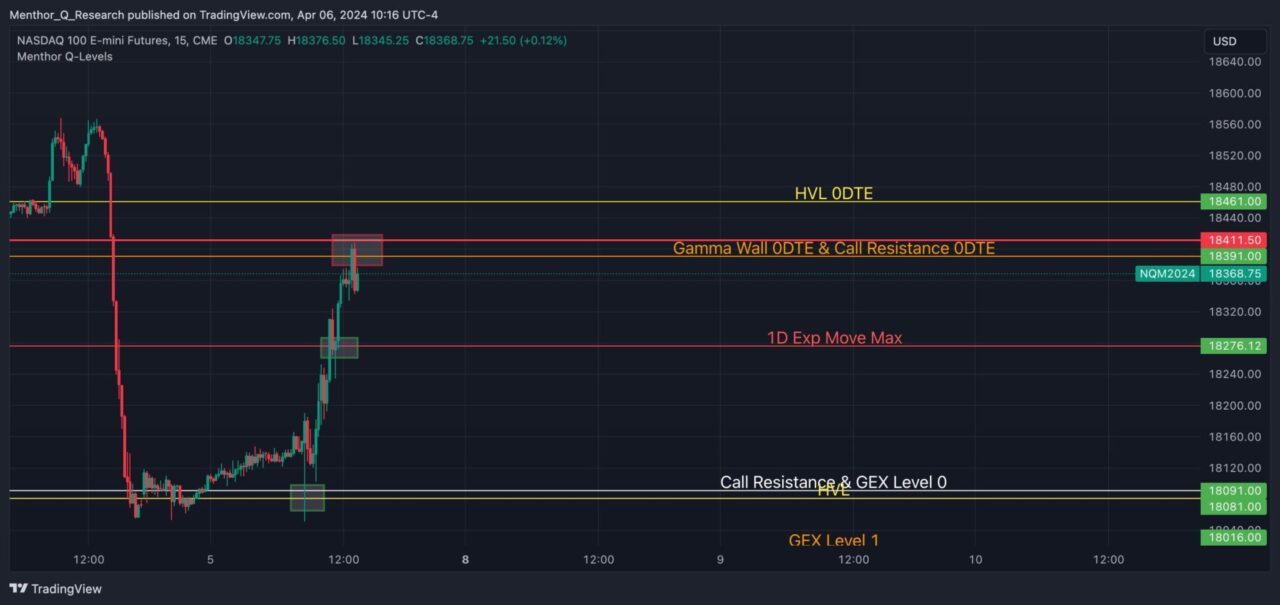
So now let’s look at combining Technical Analysis with Options Data. We have a confluence of 3 data points:
- Price reaches previous resistance
- Price is close to a very important Key Level
- RSI confirms the market is overstretched
This could have been the moment for our SHORT Trade.
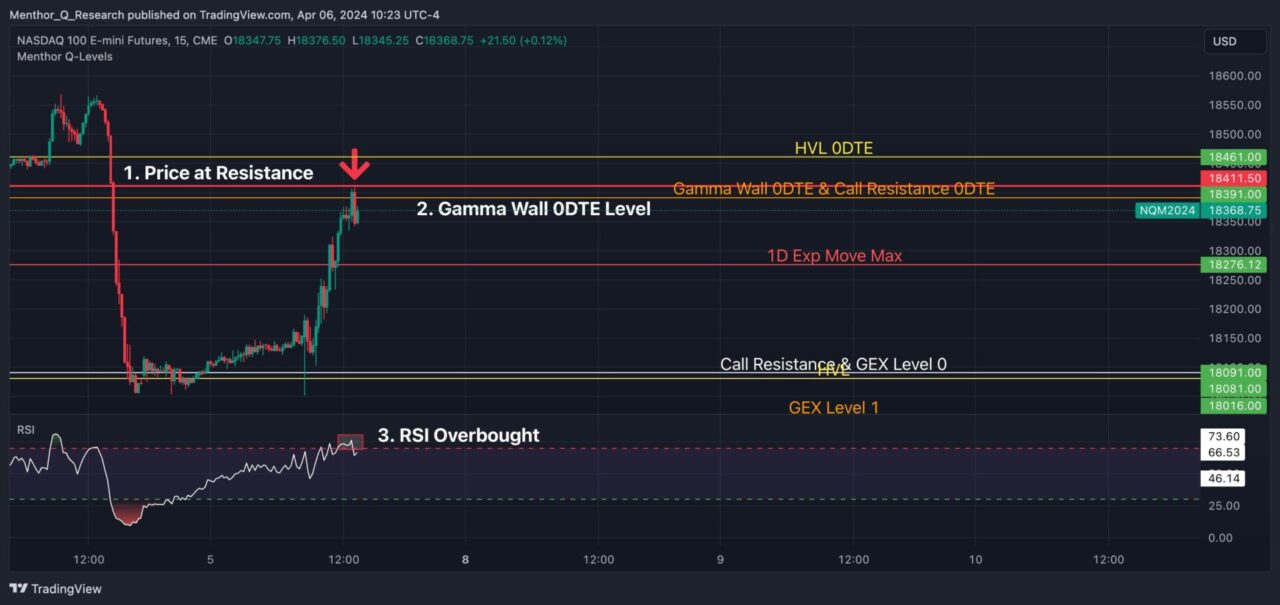
The target can be defined by your risk tolerance but we have very important data in this chart. From Risk Management we could have placed our Stop above the Resistance Level and our Take Profit Target at the 1D Max Level giving us a nice Risk to Reward Ratio of 4.54.
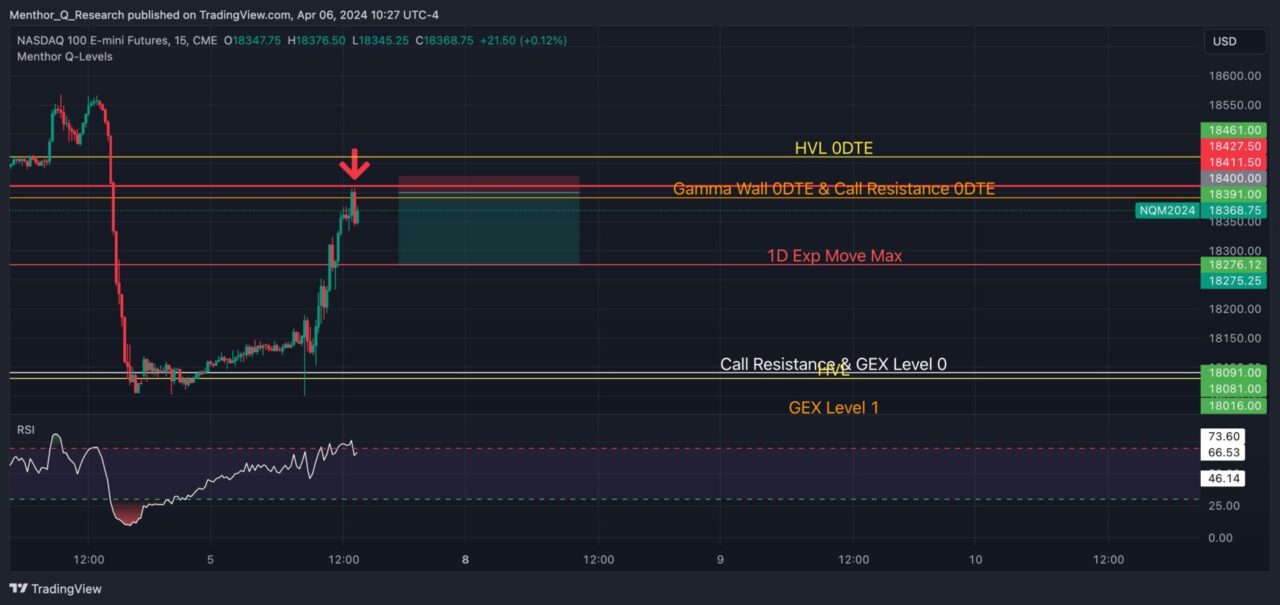
This is how the session closed on Friday.
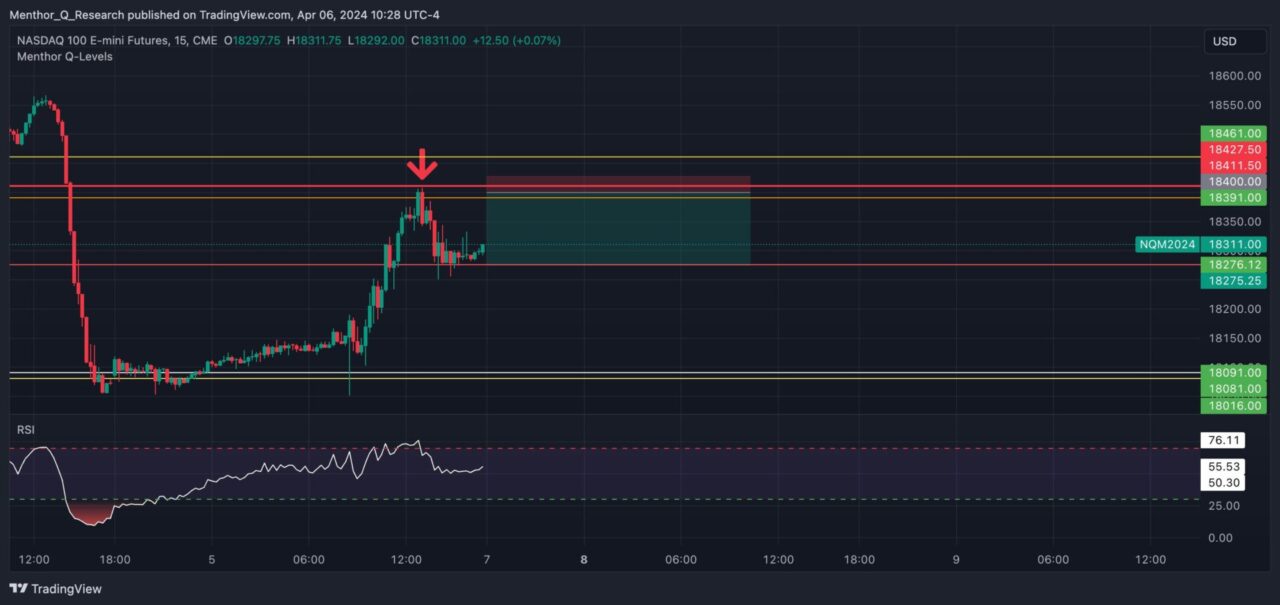
Here we can see how Patrick one of Premium users, played this trade and shared his thoughts on X.

We provide this data daily to our Premium Members. If you want to apply this approach to your trading Join us!
