Menthor Q Momentum Indicator

We have recently released a new indicator within our Premium Membership.
The Menthor Q Momentum Indicator for TradingView is a new tool that can be used with our Gamma Levels and integrates key indicators within Technical Analysis for your Trading.
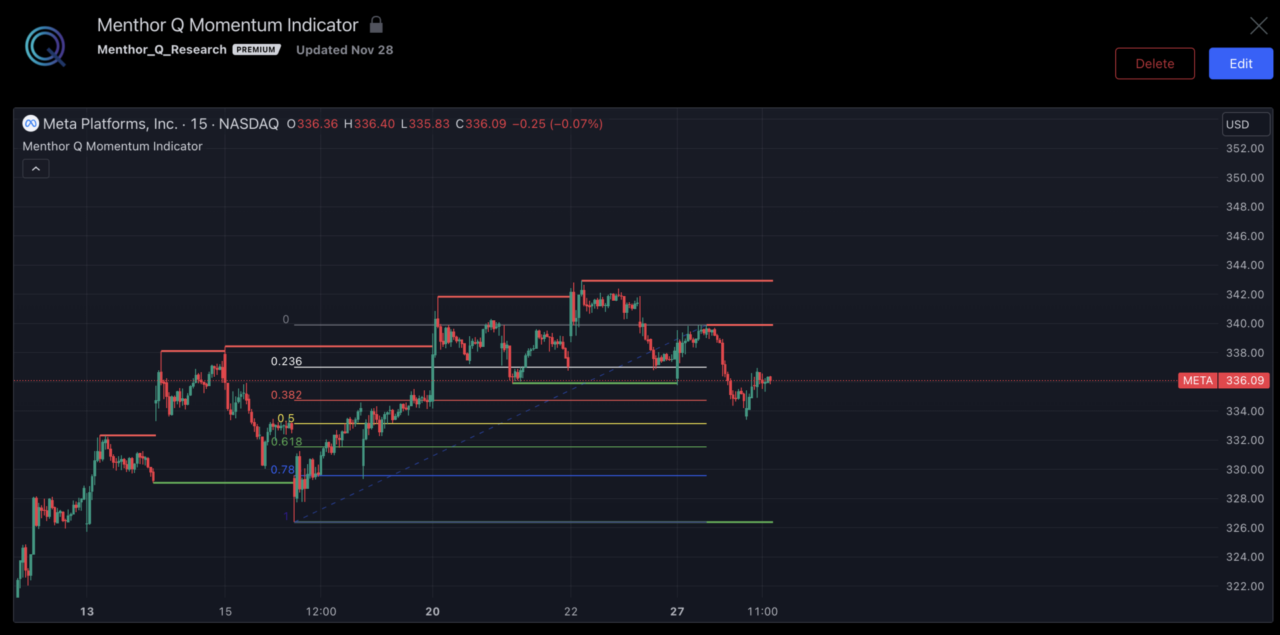
How does the Indicator work?
Within the Momentum Indicator you can access 3 studies:
- Support and Resistance Levels
- Dynamic Fibonacci Retracements
- Volume Profile
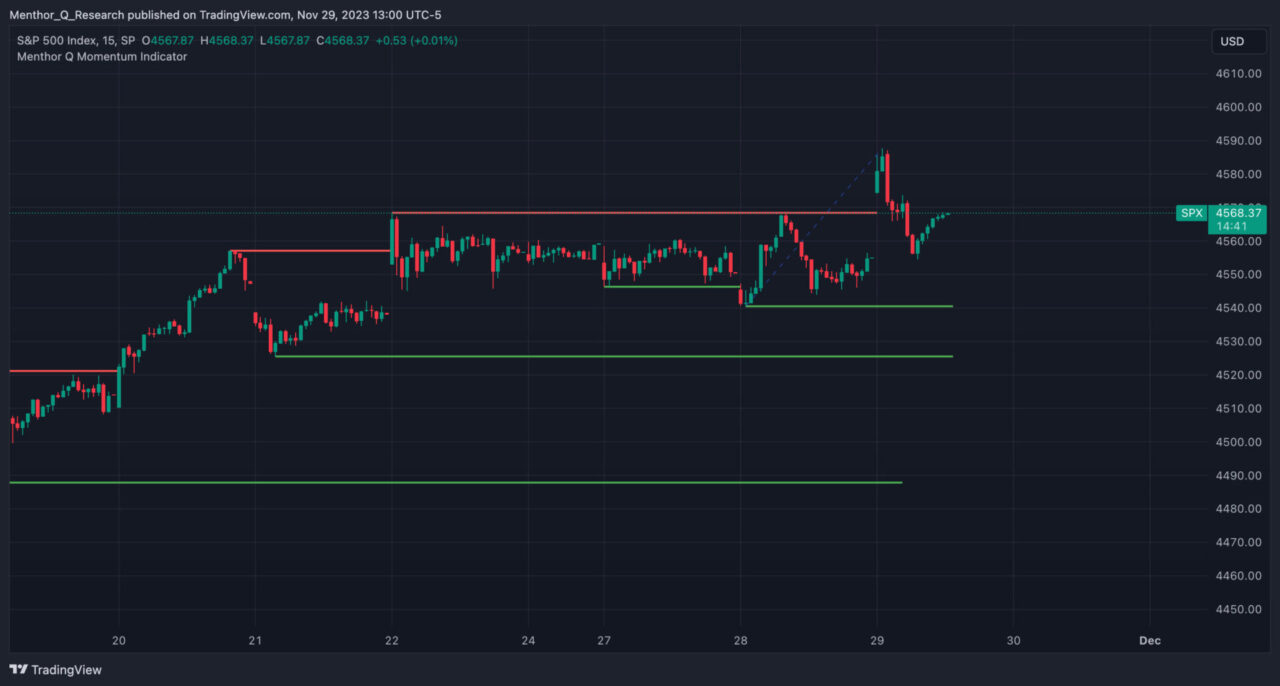
Support and Resistance
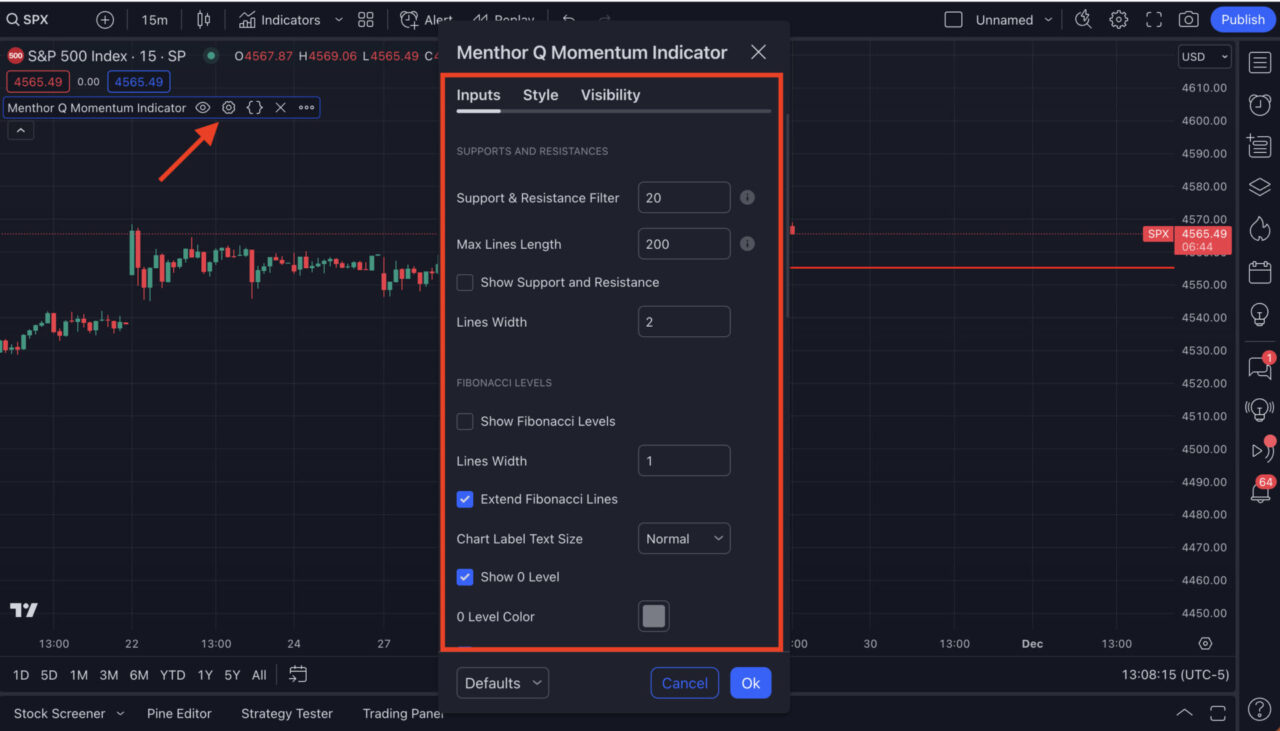
The Support and Resistance Indicator allows users to plot the most relevant support and resistance levels on a chart. You can leverage the power or TradingView and add additional indicators to support your research. Within the Indicator Settings you also have some filtering options for the levels.
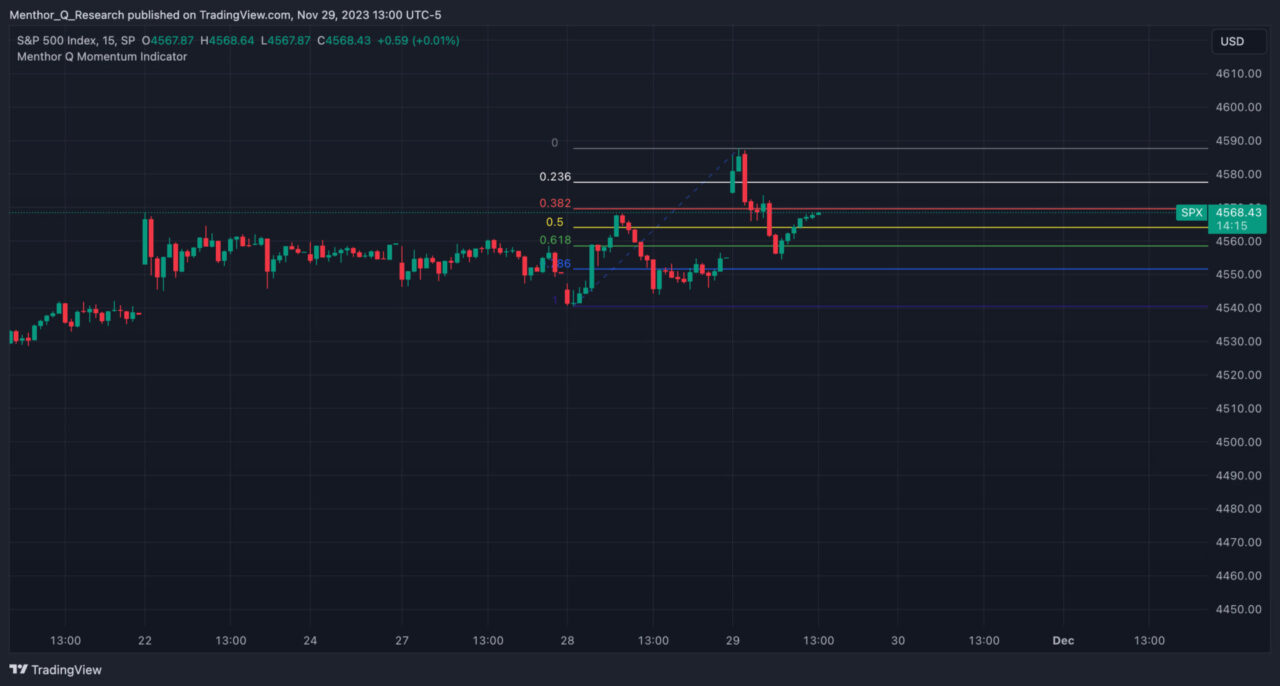
Fibonacci Retracements Levels
You can then access our dynamic Fibonacci Retracements Levels on the chart. You can choose which levels to add and you can customize the colors within the indicator settings.
Volume Profile
Volume Analysis is key for trading and this is why you can access the TradingView Volume Profile within the same chart and indicator without having to manually draw it on the chart.
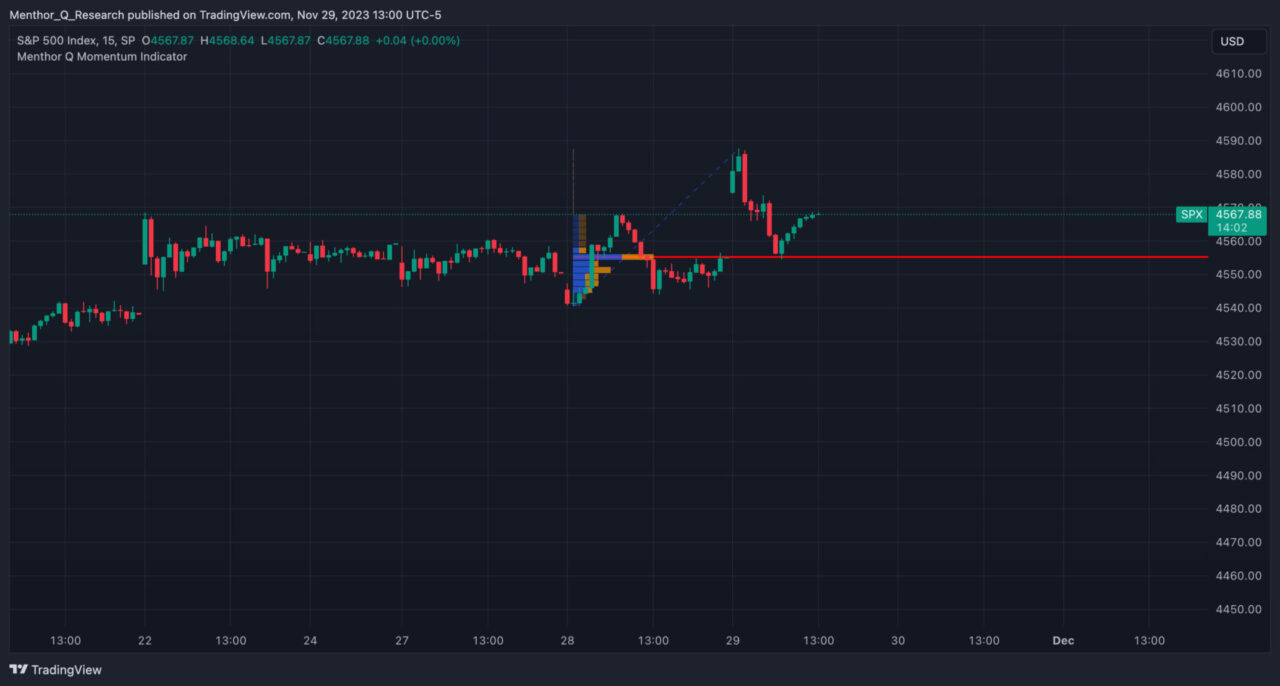
You can then add each or all of the indicators to the chart within at the indicator settings option.
You can access this indicator and all our Premium Content within the Premium Membership.
