Put Support Level

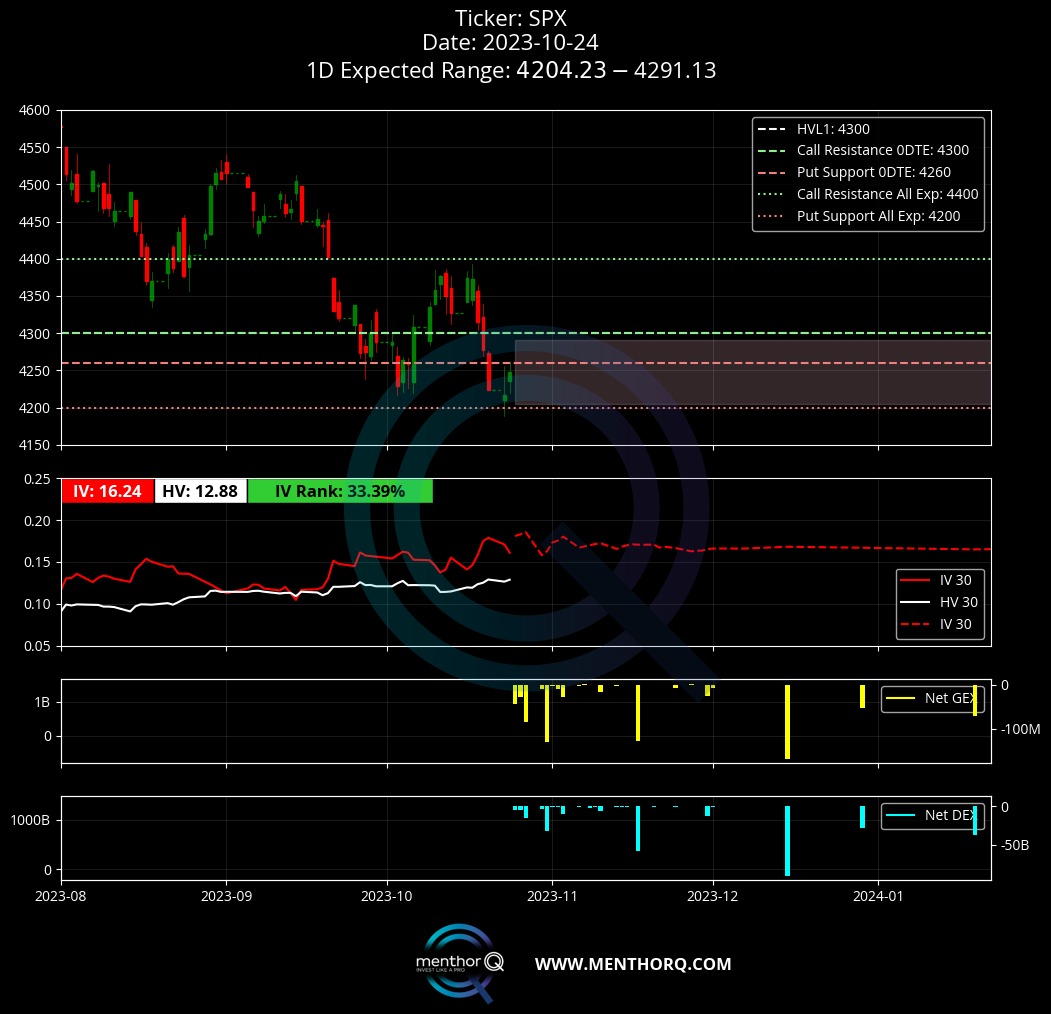
When we talk about the Put Support Level, we talk about that strike price that has more Put GEX. This is the level that our model projects as a potential level for:
- A support where the price bounces back up
- An inflection point for an accelerated downside
You can find the Put Support level in our model in the main chart.

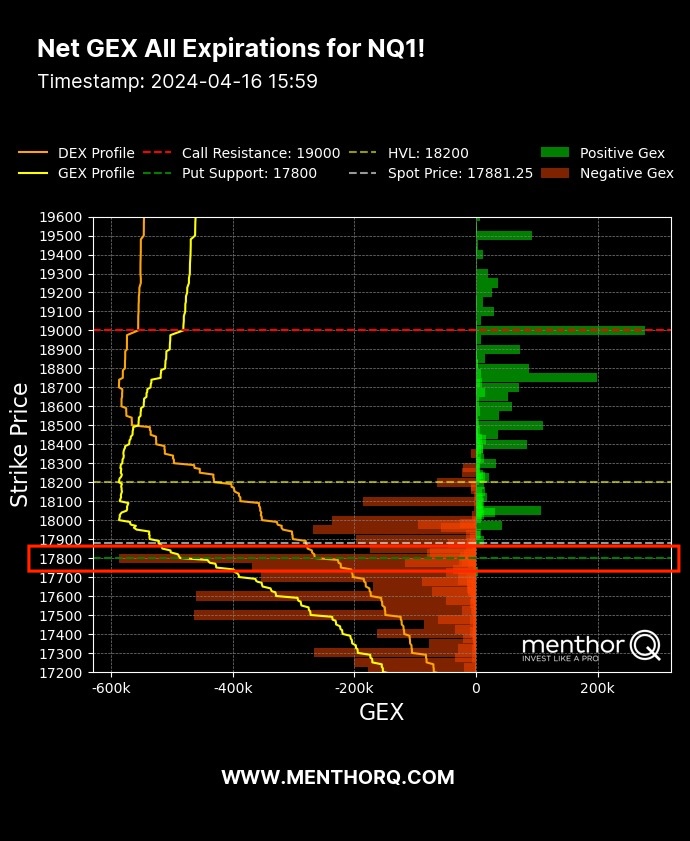
Let’s take the Net Gamma Exposure Chart to better understand why this level can become a reaction zone. The Put Support Level is the Strike Price with the highest net put gamma. This is represented by the wider Red Bar.
This also means that it is the level where there is more put open interest and put gamma. Investors and hedgers have been buying out of the money put options at that strike price.

How do investors Hedge?
Most investors will use put options to hedge their long positions and protect their portfolios. There is a speculative aspect to it of course, but big institutions use puts or put spreads to hedge.
When there is a shock in the market, implied volatility tends to go up. This is also driving the Put Skew higher. That is because the market is bidding puts. The more puts are bid, the more volatility moves up, and the more the Market Maker is shorting to stay delta hedged.
Why is the Put Support Level a Key Level?
As the price of an asset moves towards the downside puts become At the Money (ATM) or In the Money (ITM). Investors that had been buying those options for protection, as a hedge, are going to change their positioning. This level is the level where there is most put positioning.
As we get to that level, those puts get monetized by hedgers. If a hedge is not monetized, the investor cannot realize the benefit of being hedged. As they get monetized, hedges are closed, and market makers close their shorts creating a sort of short squeeze – price bounces on that level and back up. You can find the Put Support and other key levels in our Premium Membership.

You can also leverage the Menthor Q Levels Indicator for TradingView and add these levels to your chart.

What about Implied Volatility?
Implied Volatility needs to be monitored too, because changes in Implied Vol will also drive flows. If the Implied Vol that is driving put flows slows down, that will affect market makers’ delta hedge as well. They will in fact buy back shorts – this is what drives the bounce.
When we look at volatility there is another Greek we need to understand: Vanna.
While more complicated than gamma in this context, is extremely important when thinking about how market makers are hedging. Vanna looks at the change in delta due to implied volatility. You can read more about Vanna and its effects on market maker’s hedging activity in this article.
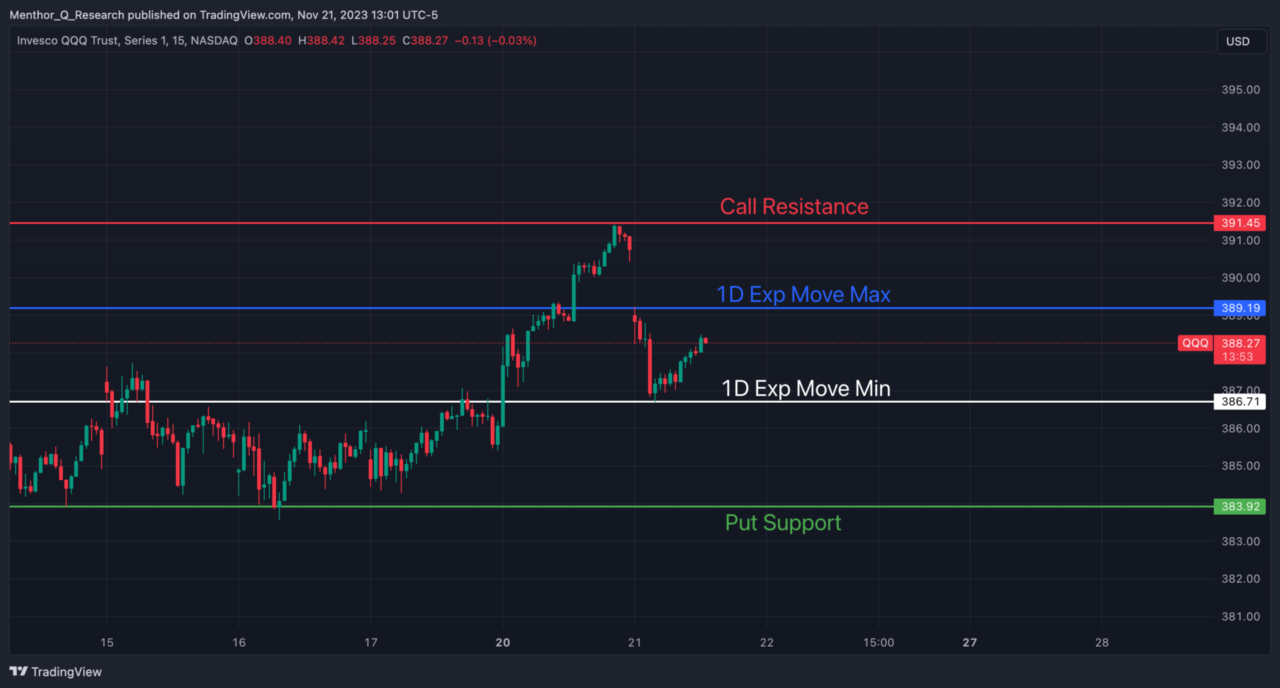
What happens when the price hits the Put Support Level?
Generally when that happens there are two possible technical scenarios for the price of the asset:
- Bounce to the upside. The Put Support level is the level where there is more put hedging activity. The market maker is usually shorting when we touch that level. As spot get closer to those puts, they go in the money. As an investor who is looking for hedging, the natural reaction is to monetize those puts. That can give the market a technical upside as market makers are now closing their hedges to stay delta hedged. If the investor is closing the put, the market maker does not have to stay short to hedge that put anymore and can now adjust its delta, and that can give the market an upside.
- Roll Positions. Once the puts have been closed, investors will have two options. Roll the hedges higher opening a new position if they think the market is bullish following the increase in spot price. The second option is to buy out of the money puts to protect their exposure at a lower strike. Now if those hedges are opened lower, that can push the Put Support level lower, and become a bearish force as market makers start hedging those new puts.
Why does it become a Support Level?
If we think about market mechanics, we know that the market maker is going short to hedge investors’ put options. As the spot price moves closer to that Put Support level, the puts that were out of the money start moving in the money.
At that point investors that were long those out of the money puts start closing those positions. The reason is obvious if you are long an OTM puts option, you will monetize it when it moves in the money.
As investors close those put options, market makers will also adjust their delta hedges. Remember, marker makers were going short to hedge those puts. As the puts are closed, the market makers close the short exposure. That stops the market from moving below that level.
The price can definitely break below this level, we have seen that happen before, that the SPX in 2020. But the break below this put support requires a further catalyst that would force investors and hedgers to move their put options below current level, driving marker makers to continue to short the market to stay delta hedged.
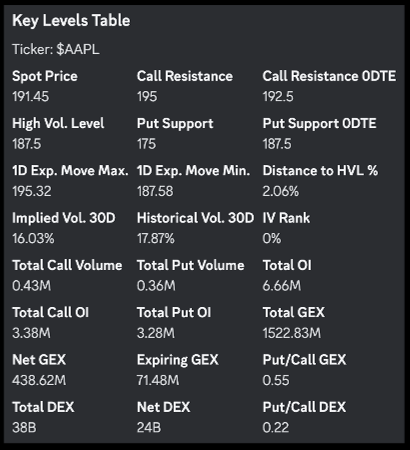
Within the Menthor Q Models we also have other Key Levels you should consider:
You can find all these levels within the Premium Membership.
