

In this guide we are going to show you how to apply Menthor Q Levels to your trading and integrate Technical Analysis with Options Data.
While technical analysis is a common tool among traders, it comes with significant limitations, such as its heavy reliance on historical data which may not accurately predict future movements.
- Technical analysis does not take into account the financial health of a company, economic conditions, or any external factors that can impact asset prices.
- Technical analysis is subjective. Different traders may interpret the same chart patterns or indicators differently, and this subjectivity can reduce the reliability of the signals.
- In many cases technical indicators are lagging indicators or delayed. They can provide a confirmation of a Trend but they cannot predict it before it happens.
At Menthor Q, we address these gaps with our data-driven approach, offering you a clearer path to better managing your trading plan.
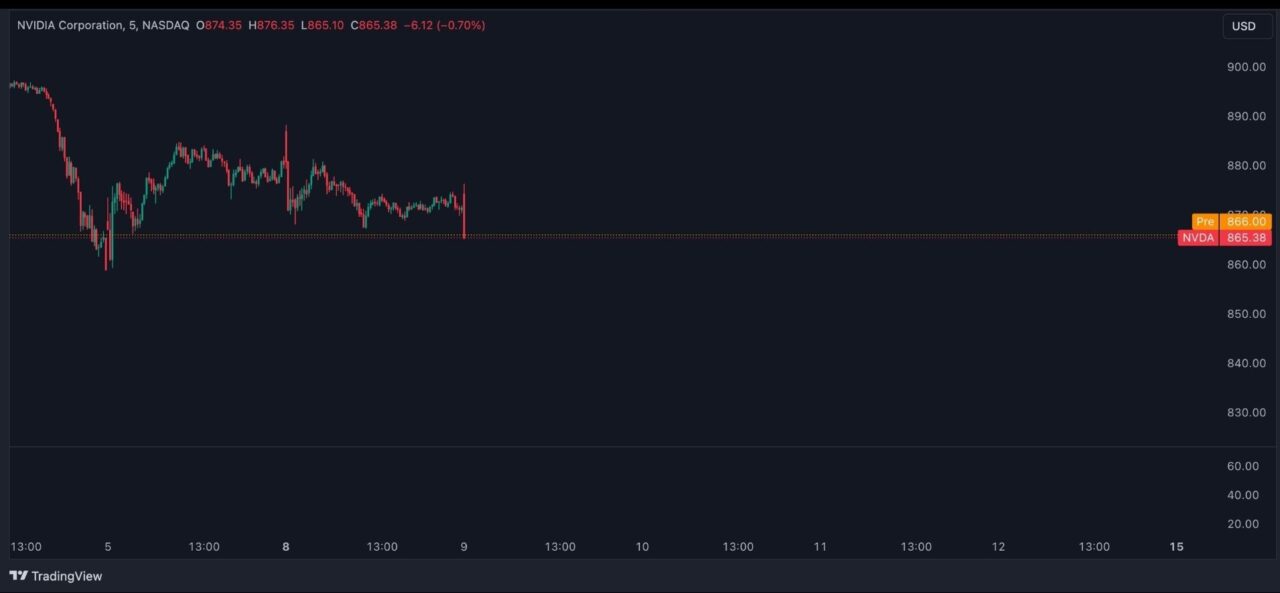
Trading NVDA using Q-Levels
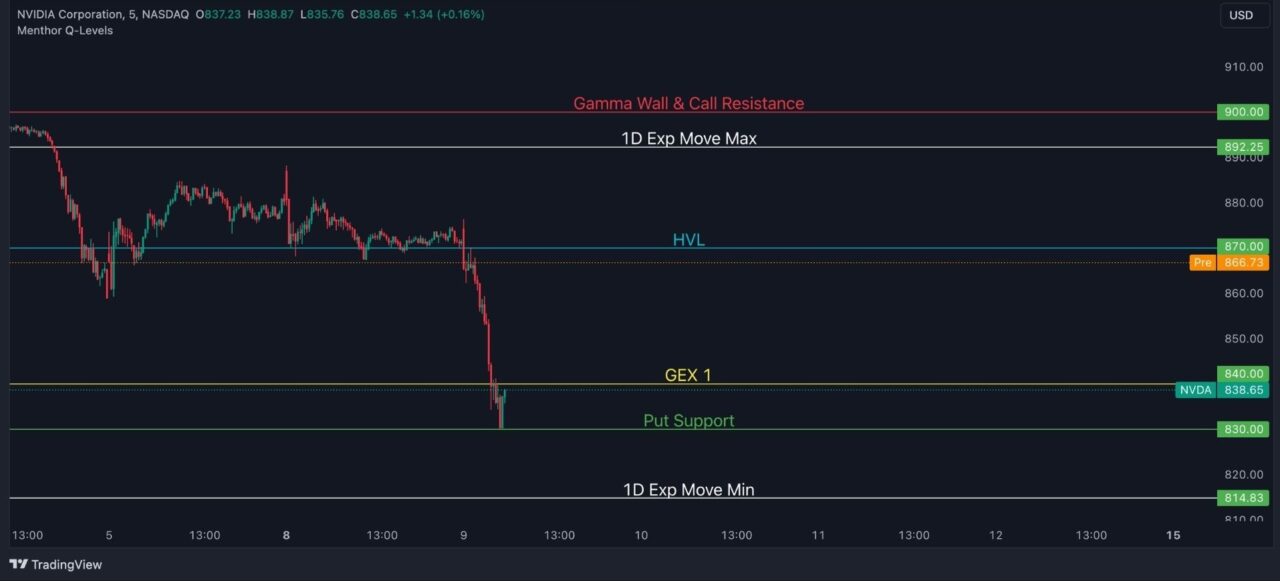
Let’s look at this chart. This is a chart of NVDA. During this time there was a strong momentum on the stock. The stock almost reached $1000 in this period and then we saw a pullback.
What would you do? Would you go Long or Short?
If we simply use Technical Analysis and add our indicators like our Support and Resistance or RSI we might consider going long on this stock at these levels.
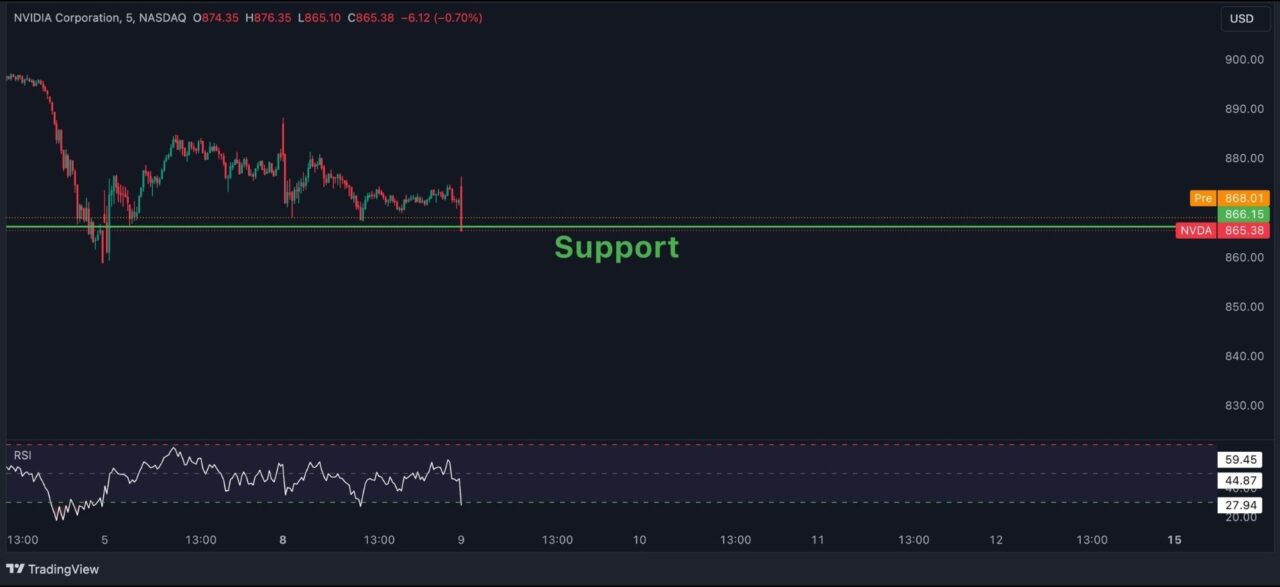
Now we would have been wrong and we would have lost on the trade.
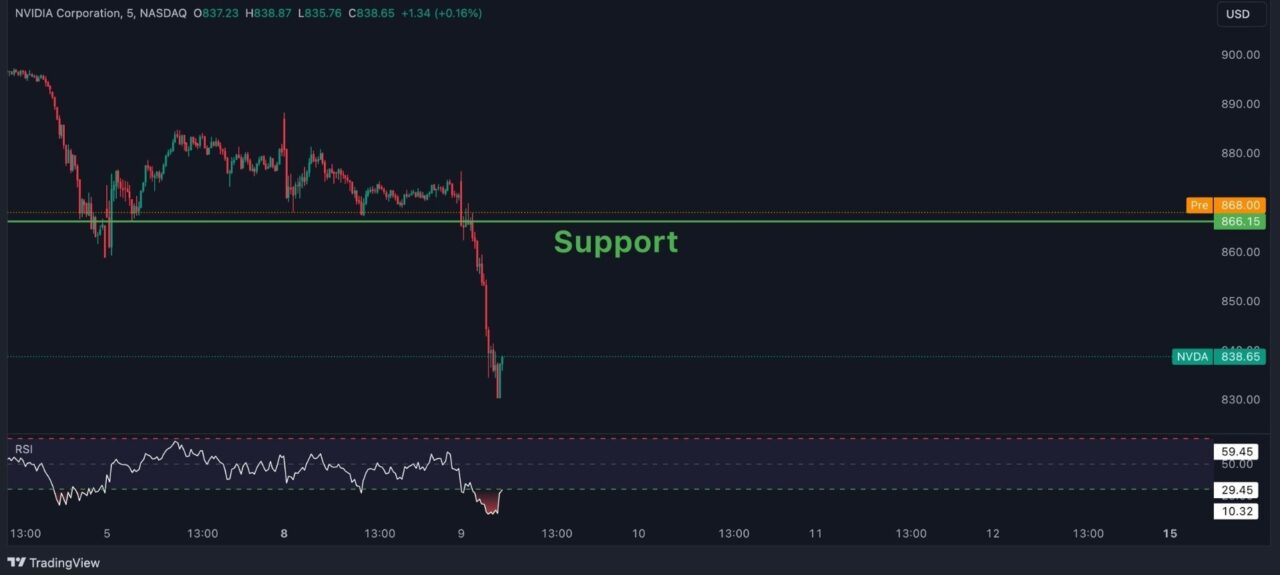
What if you knew that most market participants were protecting themselves on that level. They bought a lot of Put Options to protect from potential losses. This is where understanding the option positioning comes into play.
This is the Menthor Q Net Gamma Exposure Chart that shows Market Positioning on the Stock. The red bars highlight a large amount of put positioning. You can access these charts in the Premium Membership.
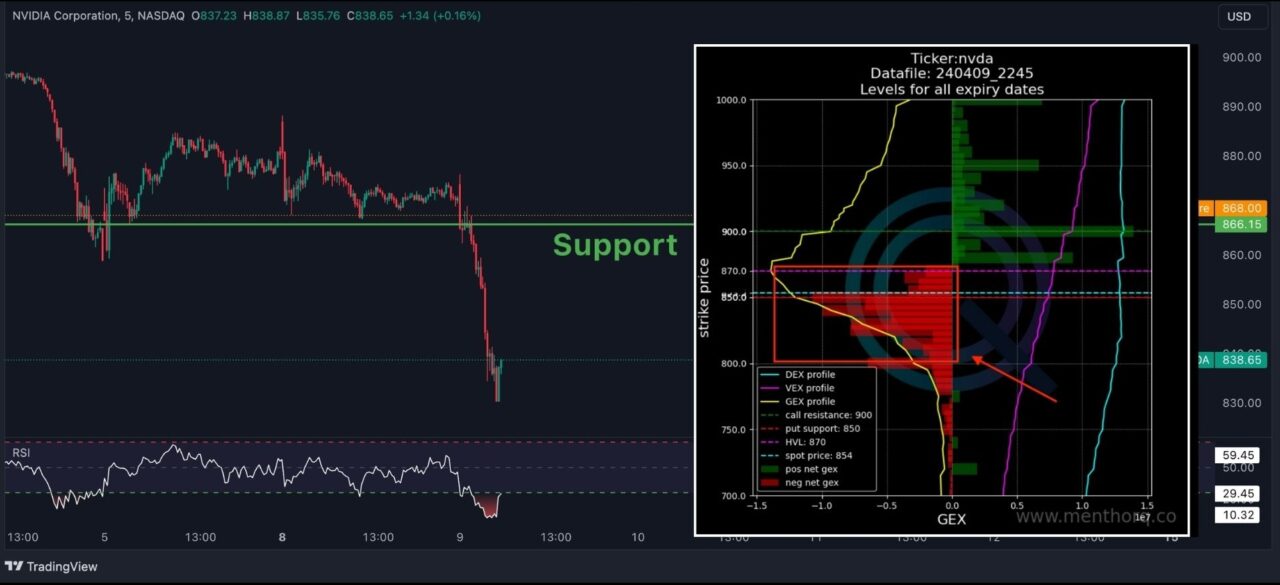
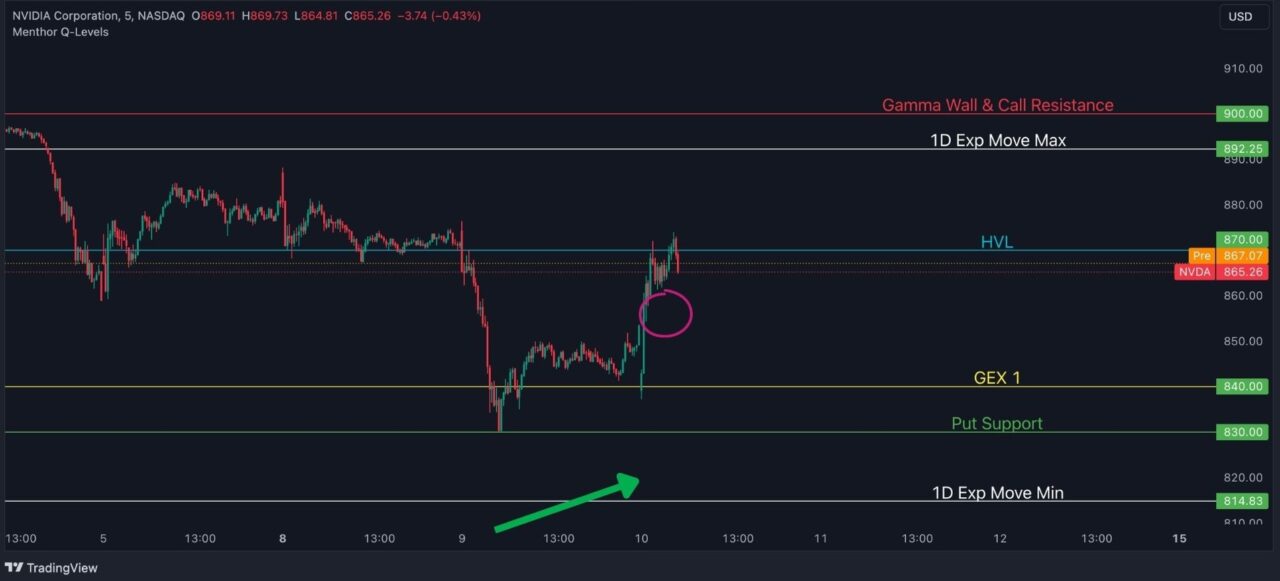
And what if you were able to plot these levels on a chart together with your favorite technical indicators. This is now possible with the Menthor Q Levels Indicator. We are able to take the data coming from the options market and plot it on a chart to help you make sense of complex information to make smarter trades in a simplified visualization.
We can now add those reaction zones directly to the chart. Complex data is now simplified giving traders a clearer picture.
In this example our Put Support Level would have given us a very strong signal for a long trade. Our High Vol Level or HVL could have been our profit target for this trade.
But what if we wanted to stay in the trade?
We can add the Levels for the next day and see the change in positioning. We see a potential target at our Call Resistance Level or our 1D Max Level. The price breaks the Gamma Wall with a strong Momentum and reaches our 1D Max.
So now what do we do? We wait for more upside or we close our trade?
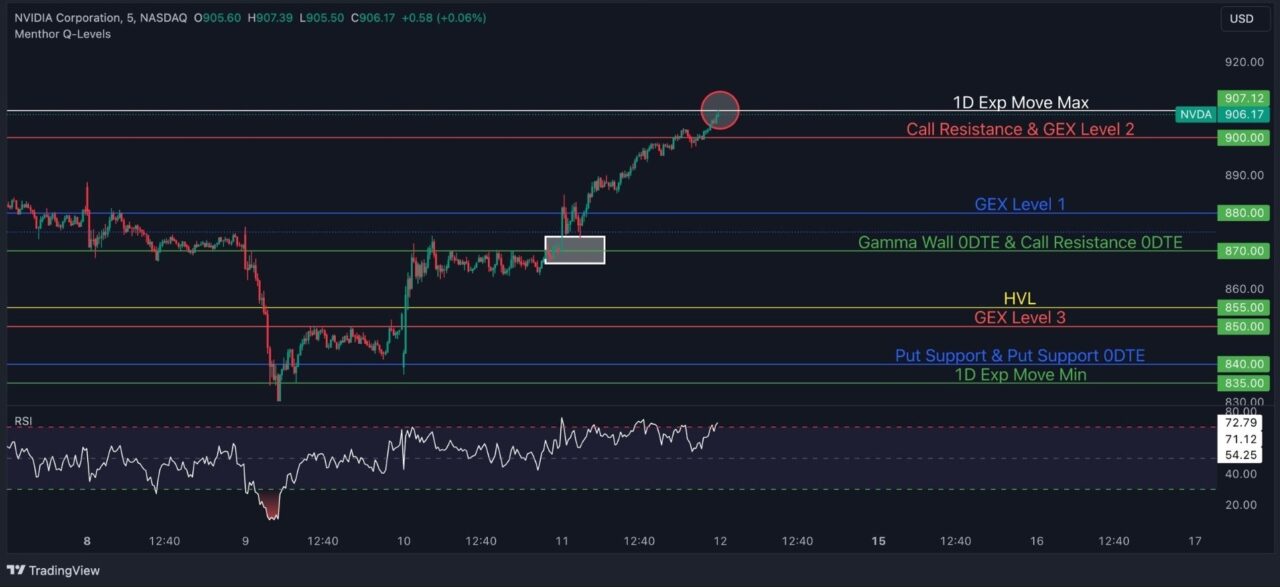
What if you had some backtesting results that shows that the price of Nvidia closes below the 1D Max Level on 90% of the time. Would you still keep the trade or would you close it? You can find these results on our website.

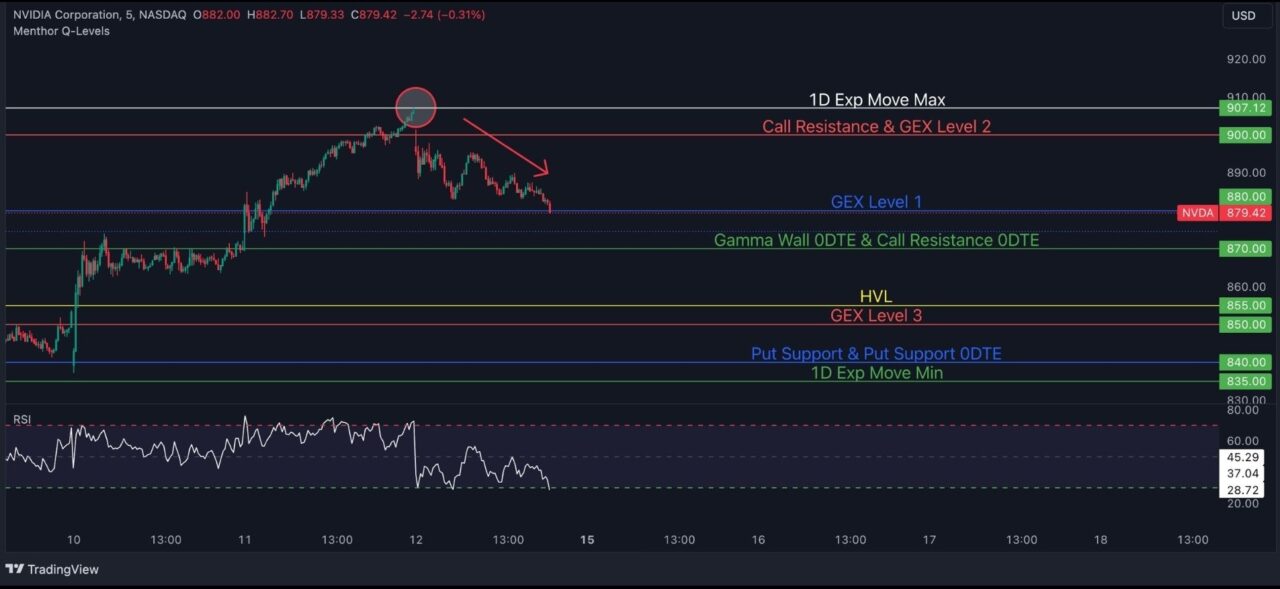
The price in fact retraces back right on the 1D Max Level for the day. You are now no longer trading blind. You have data to support your decisions.
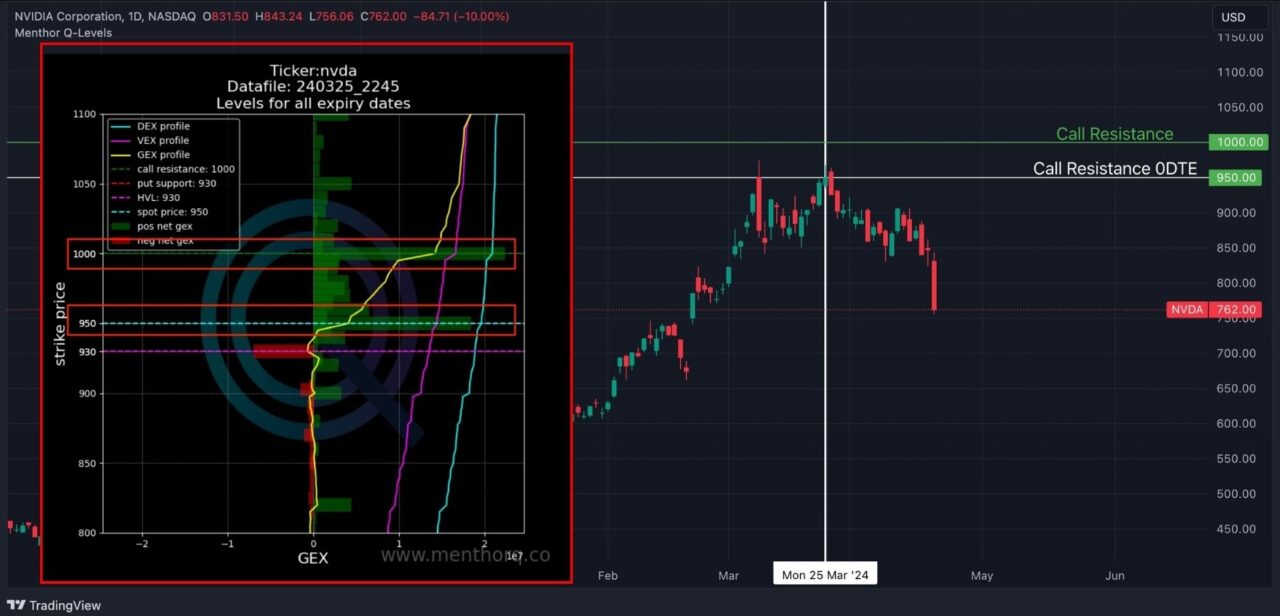
NVDA Call Resistance Level
Let’s look at this chart. This is the chart of NVDA at the end of March 2024. We are in a strong uptrend and on March 26th the price is approaching the $1000 dollar mark. Here we see the Net GEX or Net Gamma Exposure chart from our models and we can identify 2 key levels: the Call Resistance and the Call Resistance 0DTE which looks at the market positioning at the next weekly expiration.
The $1000 level and the $950 level are the one with the highest exposure. As we can see from the chart the price reaches this level and then retracts. It fails to break above.
Trading SPY with Menthor Q Levels
Now let’s look at this chart. This is the chart of SPY on April 9th 2024. Here we see a bearish price movement with a breakout of both the 200 periods Moving Average as well as an important support level. As a result from a technical standpoint this could have been a good signal for a short trade. The price moves down and we would have been successful.
But what about Risk Management and our Trading Plan? It is key that we define a stop loss level and take profit targets for every trade to be successful.
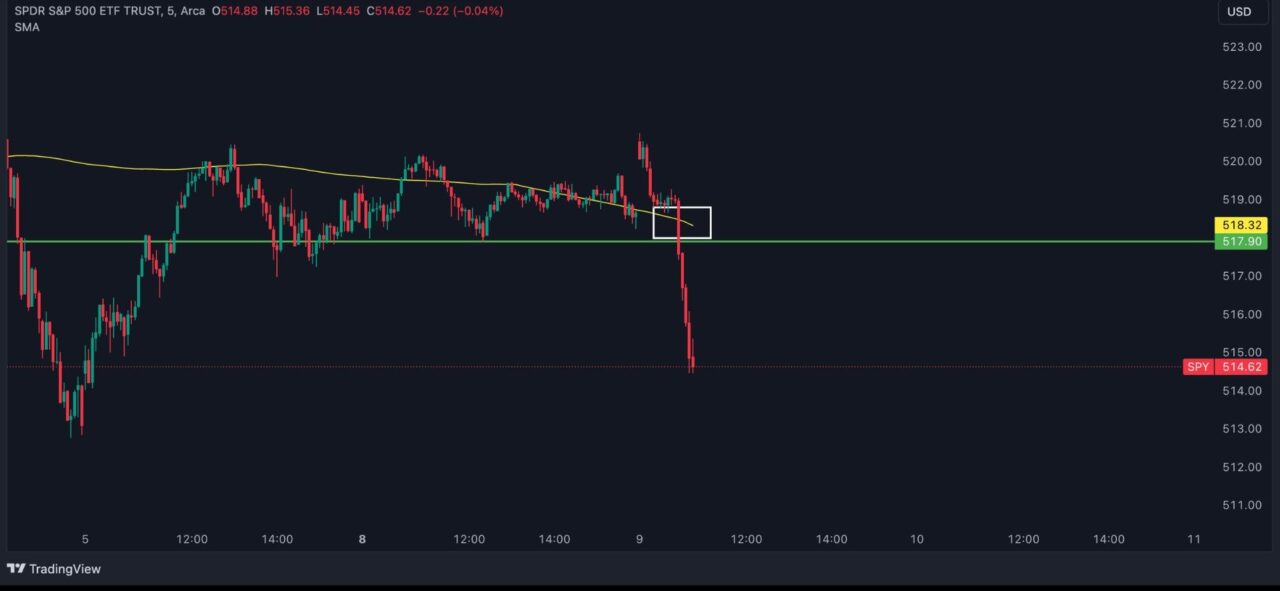
In this case if we used pure technical analysis we would have looked for a pivot point or a support level to define our target. The green line could have been an area of target.
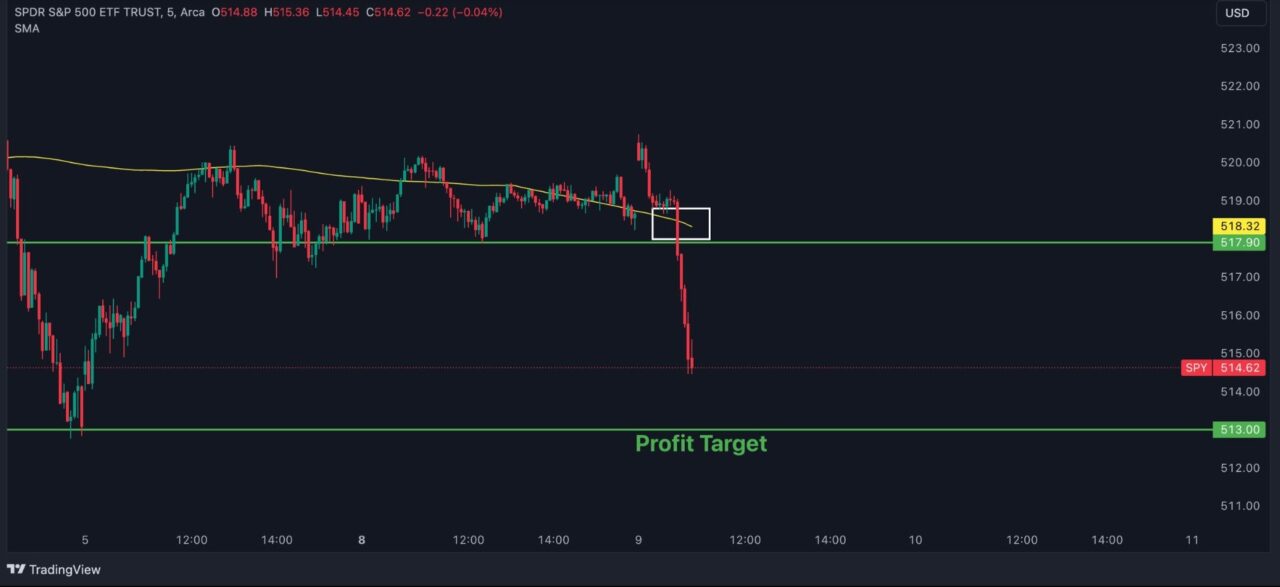
But as we can see we would have been wrong and would have given away a large portion of our profit putting at risk our successful trade.
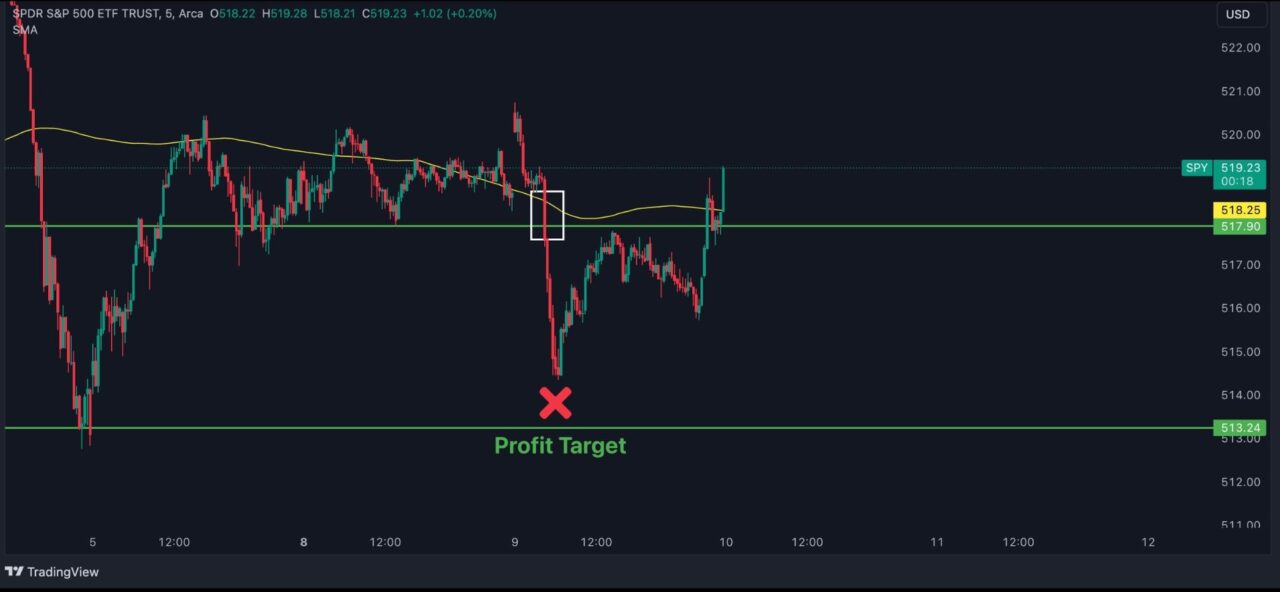
Now what if you had a better way of managing this trade. Let’s look at a different approach. Let’s use our Quant Technical Method. We can add the Menthor Q Levels to the chart.
The price reaches the 1D Expected Minimum indicator, stops and retraces back. The 1D Exp Move Indicator aims to forecast the next day price movement of an asset by looking at Forward looking Volatility and Options Positioning. In this example the 1D Min could have been used as our profit target for our short position and could have even given us a good entry point for a Long Trade.
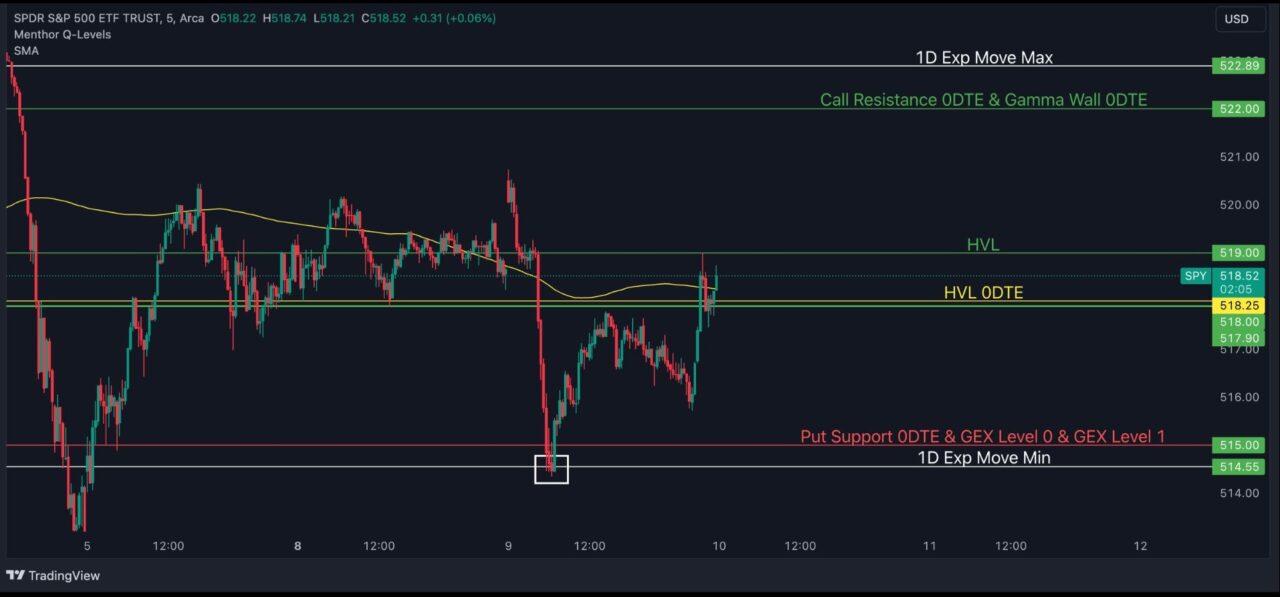
So in this example we can trade having an additional layer of protection and the power of data. We want to use those reaction zones to help us better manage our plan and our risk.
You can access all our Models and Data within our Premium Membership.