Trade the market using the Net GEX Levels

The last couple weeks have been great to further understand the importance of understanding the technicality of the market. As we have pointed out before, fundamentals ultimately will prevail in markets. But fundamentals may take months, years of even decades to materialize.
Contrary to what some pundits will tell you, things do not really change. The market ultimately always behaves in a certain way during the long term. Understanding what type of investor you are is also understanding what type of timeframe you can play in. There is nothing wrong in being a fundamental long term investor. That works for certain characters who have specific skill sets.
Others may be more suited for the short term trading. Now playing in the short term requires a different personality but also a different understanding of how the market works. Markets in the short term are very erratic, and it is easier to lose money than in the long term (that is a generalization of course).
This is one of the reasons we are always talking about the importance of risk managing your book. Because things can go against you very fast. You have to make sure that you take into consideration all those facts that can affect your price movement. Another reason why we really don’t like to trade around events, is because risk management becomes harder. Or to better put it, you have to have way tighter risk management.
Trading the Market with Net GEX Levels
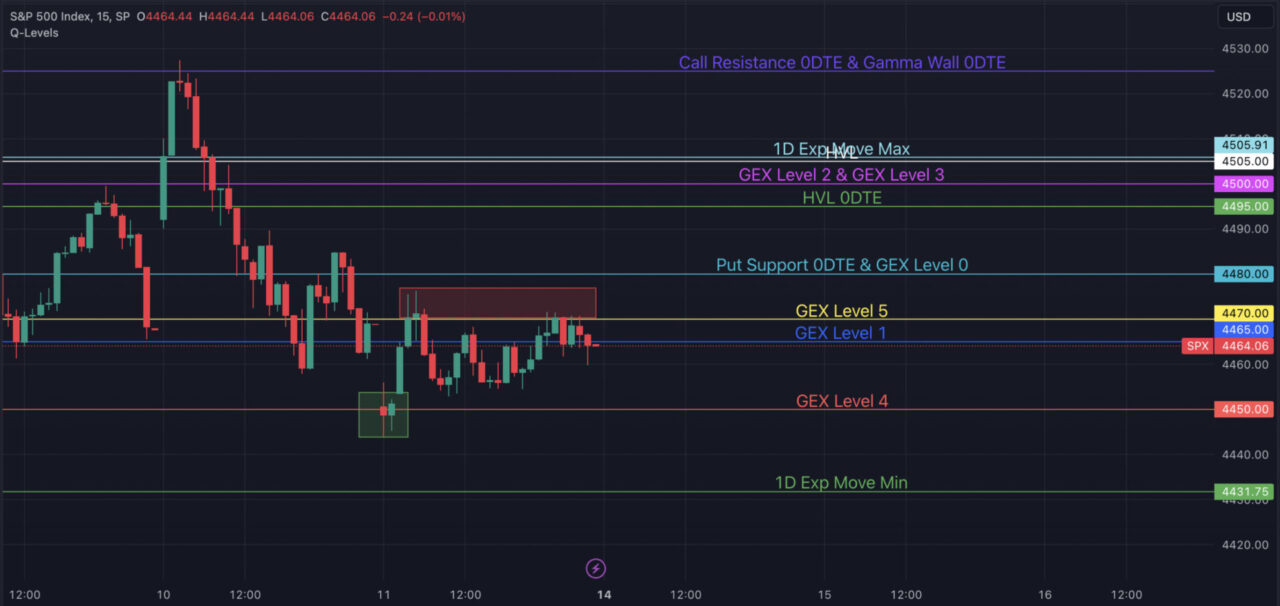
Now let’s take a screenshot of our models. The levels are using option data from close of Thursday. We set up these before the market opened on Friday. In the red square you can see how the GEX Levels acts as support and resistance throughout the day.

What do we notice here?
First of all we are in negative gamma and below the High Vol Level. This tells us automatically that the day is going to be more volatile than if we were above the High Vol Level in positive gamma.
In the cases where the market price moves away from the key levels (PutSupport, Call Resistance and High Vol Level), we look for those secondary levels to come into play (the ones in the square). Those levels are basically the Net GEX level you see in the morning in this chart.

It is important to know your Net GEX levels because when we are in negative gamma, the market tends to become directional. Those are the times that understanding your sticky levels becomes key because price hovers around them
Why is Volatility still so low?
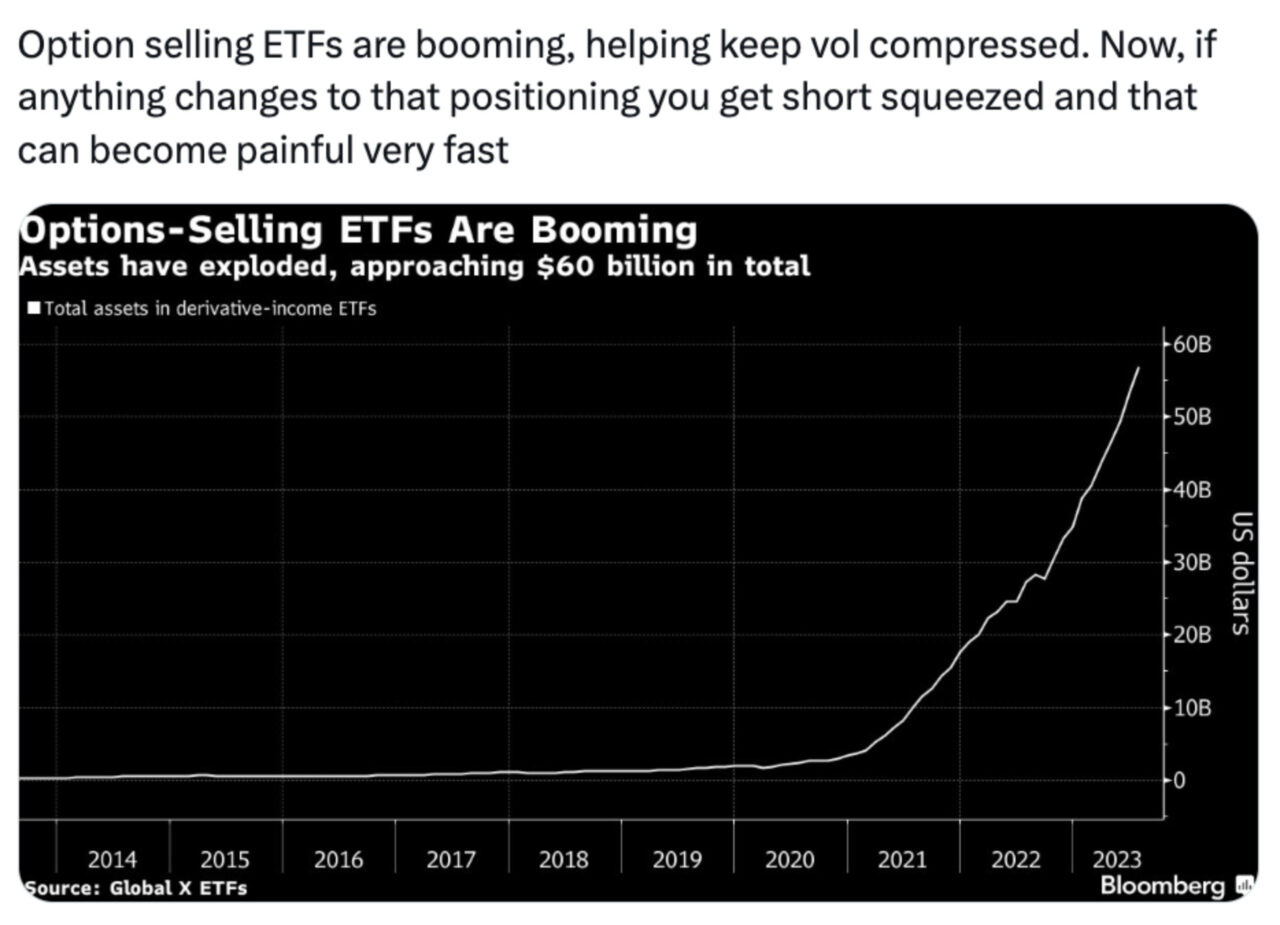
Many have asked this question, volatility sellers have been coming in force. There is no surprise here, as investors look to go long equity exposure and short VIX to harvest yield. According to data from Bloomberg, ETFs have been shorting close to $57B of assets. Now this strategy is currently looking at a return of 20%.

The importance of the Greek Vega
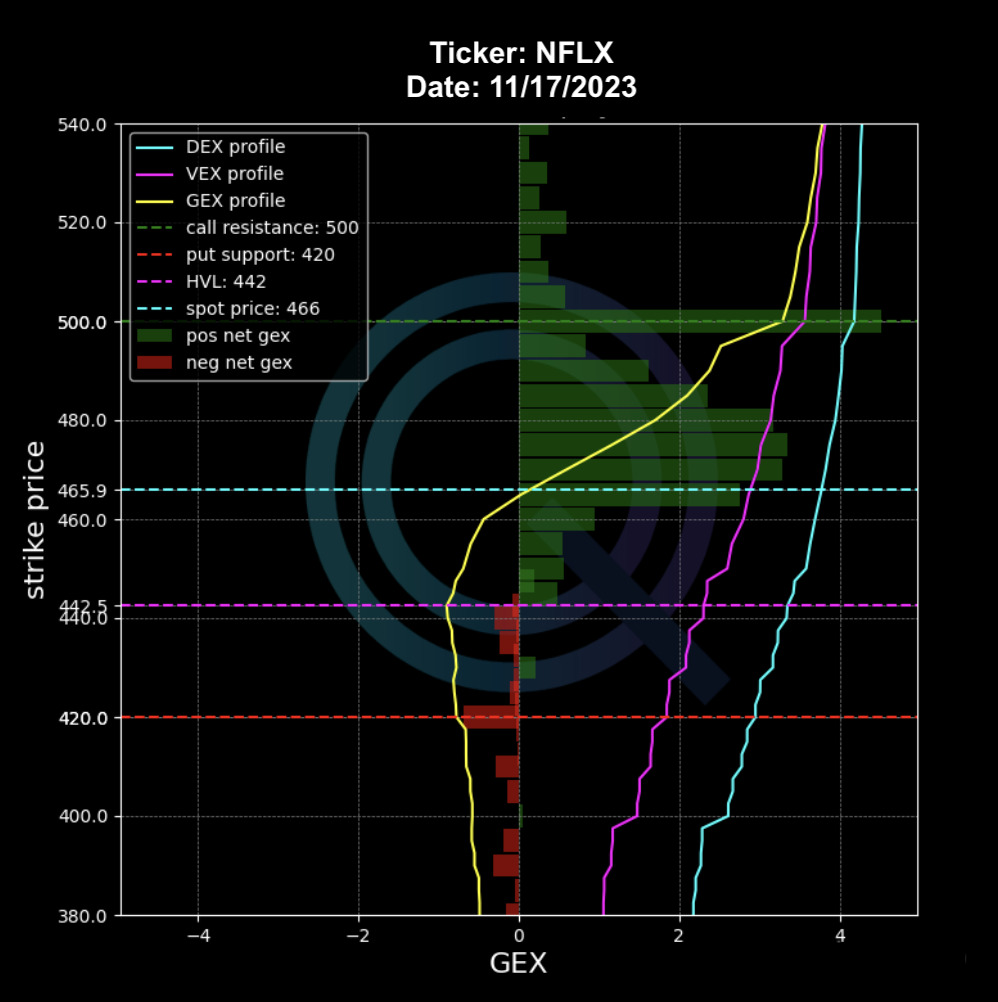
The issue with these strategies is always the same, compressing volatility is like a rubber band. It works until it doesn’t. When it does not the swings become accentuated and affect the broader market. Here we can see the Net Vega in the market.
This is the greek that the market makers need to hedge when volatility is shorted at these levels. Vega is basically the sensitivity of an option price to changes in the volatility of the SPX (or any other underlying).
Through the vega we are quantifying how much the price of the option will change for a 1% change in Implied Vol of the SPX. When IV moves, option pricing changes together with premiums. To give you an example, a Vega of 0.20, implies that a 1% move in IV will increase/decrease the price of the option by $0.20. In the current scenario, the dealers are actively hedging that vega because the more the market shorts the higher the volatility risk becomes, as well as the overall vega of the book.
You can learn more about Options Greeks with the Menthor Q Academy.
