Trading Commodities
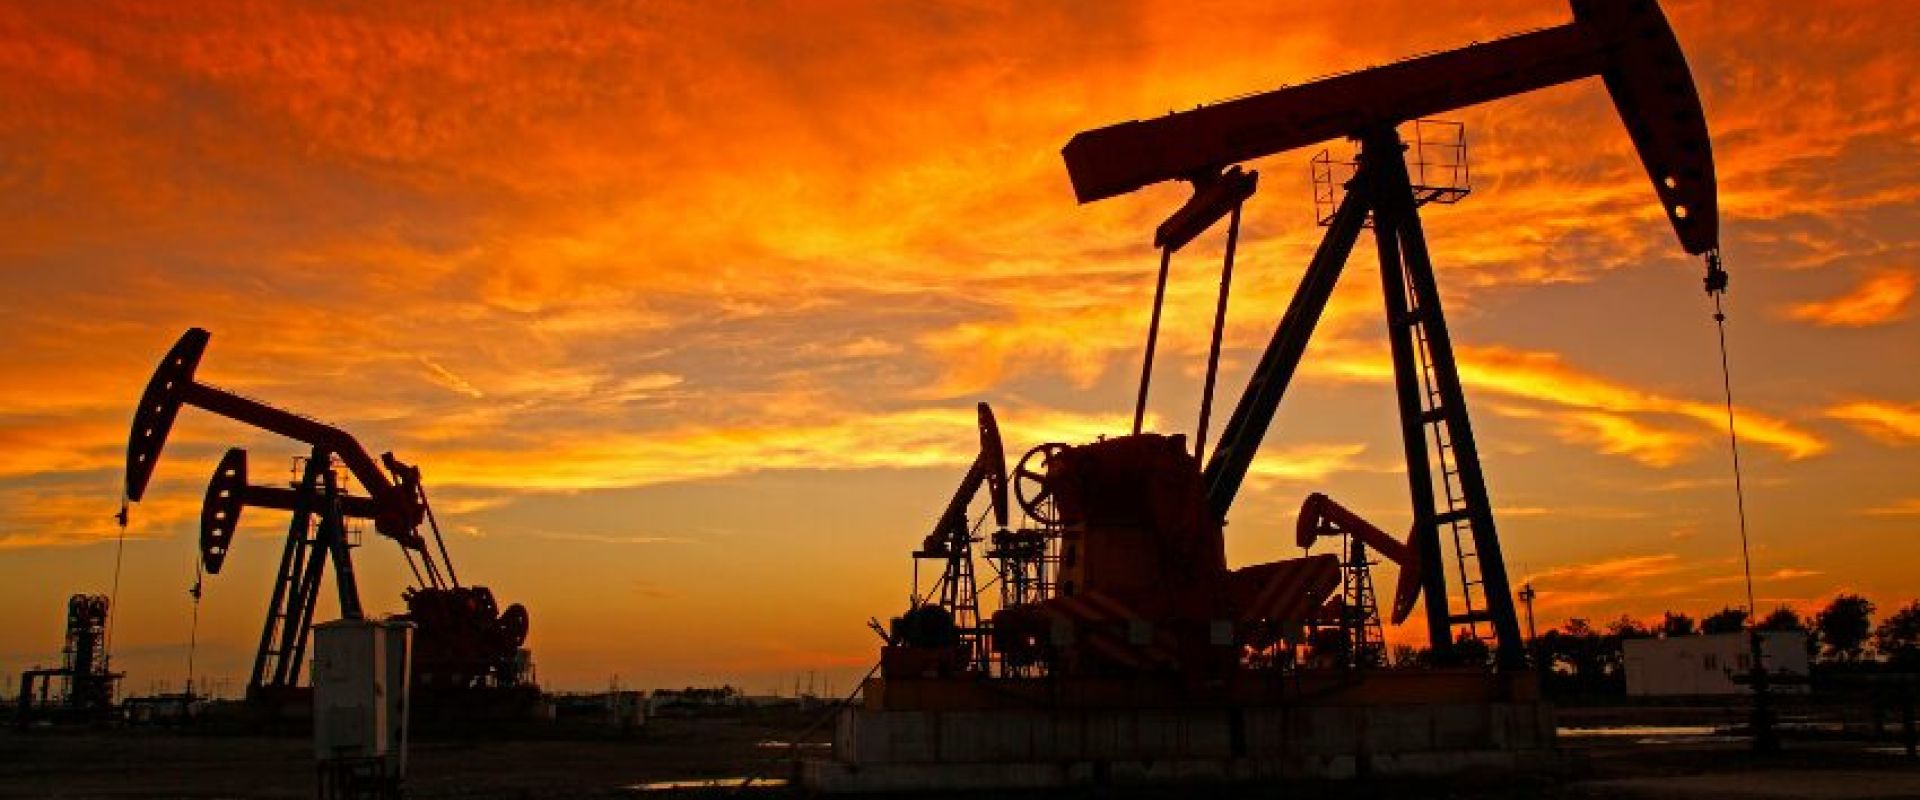
Commodities play a crucial role in our everyday life. From food to energy, pretty much everything around us in a physical form comes from commodities. Throughout history Empires rose because of their ability to access commodities. That is still true today, and commodities continue to play an important role in the political landscape.
In this article we will talk about the important commodities and will focus specifically on oil. We will understand what is required to trade this asset and how we can trade it using the Q-Models.
Which are the Major Commodities?
Commodities are broadly categorised into four main groups: metals, energy, livestock and meat, and agricultural products.
Metals
Let’s start from metals. With AI, the development of technologies and green transition, certain metals like copper have become increasingly important. But let’s see what are the important metals:
- Gold
- Silver
- Platinum
- Copper
Precious Metals: Precious metals like gold are favoured during market volatility or bear markets due to their reliable value and are used as hedges against inflation or currency devaluation.
Tech Industry Impact: Rare earth elements (e.g., dysprosium, erbium) are critical for tech products like electric vehicle motors and smartphones. Metals like lithium, cobalt, and nickel are essential for renewable energy storage, leading to competition for access, especially in regions like central Africa. Major trading houses including key figures like Jeff Currie called Copper the new oil.
Energy
Next we have energy. Everything in life is energy, as you would expect these next commodities are very important. Today, while there is a big push to a green translation, crude and oil products still play an important role in our societies especially in the transportation sector. These are the main energy commodities
- Crude Oil
- Heating Oil
- Gasoline
- Natural Gas
- Biofuels are increasingly becoming more important, among the most important biofuels we have renewable diesel and sustainable aviation fuel.
Global economic developments, oil production levels, and advances in alternative energy sources impact prices. Despite shifts towards renewable energy, oil production remains significant, increasing from 73.6 million barrels per day in 1998 to 93.9 million barrels per day 25 years later.
Livestock and Meat:
These commodities focus on what we eat and how we raise what we eat.
- Beef
- Pork
- Lamb
- Chicken
- Turkey
Livestock trade is essential for global food supply, with significant impacts from trade agreements, tariffs, and international relations. Despite a shift towards alternative proteins, meat consumption is expected to rise by 14% by 2030 due to increasing incomes and populations. Poultry is gaining preference due to its lower cost and perceived health benefits, expected to make up 41% of meat protein sources by 2030.
Agricultural Products
Just like livestocks, agricultural products play an important part in feeding the world. But not only, with the energy transition they are becoming a key component for the biofuel industry. For example soybean oil is an important feed for biofuels.
- Corn
- Soybean
- Wheat
- Rice
- Cocoa
- Coffee
- Cotton
- Sugar
Population growth, climate change, consumer preferences for organic and locally sourced foods, and technological advances shape the sector. Issues like weather patterns, extreme weather events, genetic modification, globalisation, government policies, and sustainable farming practices also play crucial roles.
Innovations such as GPS, IoT devices, drones, and big data analytics have improved farming efficiency and yields, addressing challenges like reduced agricultural land due to urbanisation.
Why do we trade Commodities?
Overall, commodities trading offers opportunities for diversification, inflation hedging, and potential high returns, but it also requires understanding the complex factors influencing each commodity category. To trade commodities one has to have a good understanding of:
- Physical supply and demand
- Logistics
- Asset Volatility
- Positioning
- Systematic funds positioning
Trading commodities can be a strategic addition to an investment portfolio for several reasons:
1. Diversification:
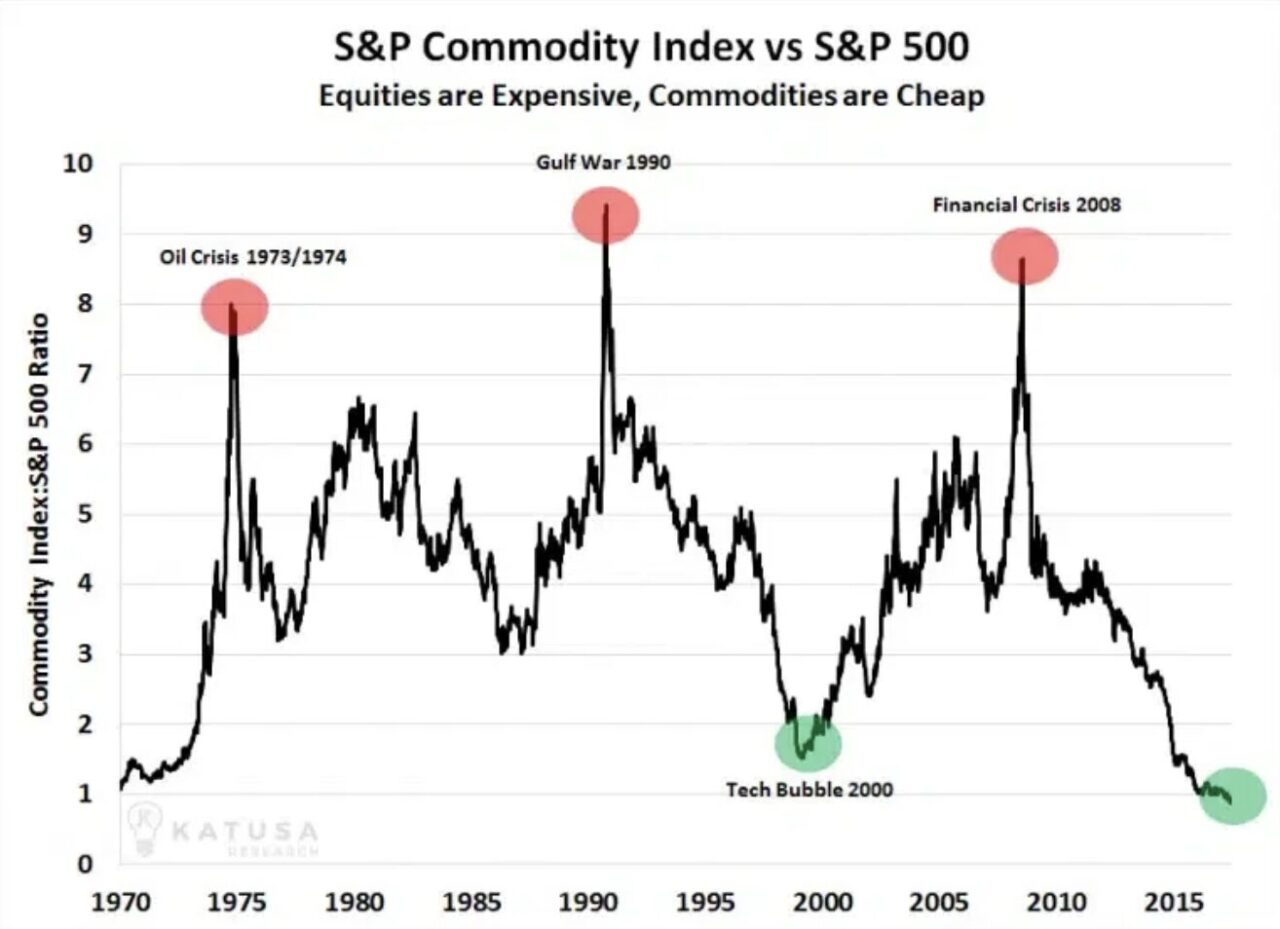
Commodities often have a low correlation with traditional asset classes like stocks and bonds. This means they can provide a diversification benefit, reducing overall portfolio risk. The easiest way is via an ETF, but because of the forward curve, understanding how futures roll is necessary. When using an ETF one can focus on commodity equities to avoid roll risk. While that is easier, you take equity risk and not fully commodity risk which is what an investor in commodities wants. Investing with futures and options offers the best way to take that exposure, but requires a deep understanding of the instruments.
2. Inflation Hedge:
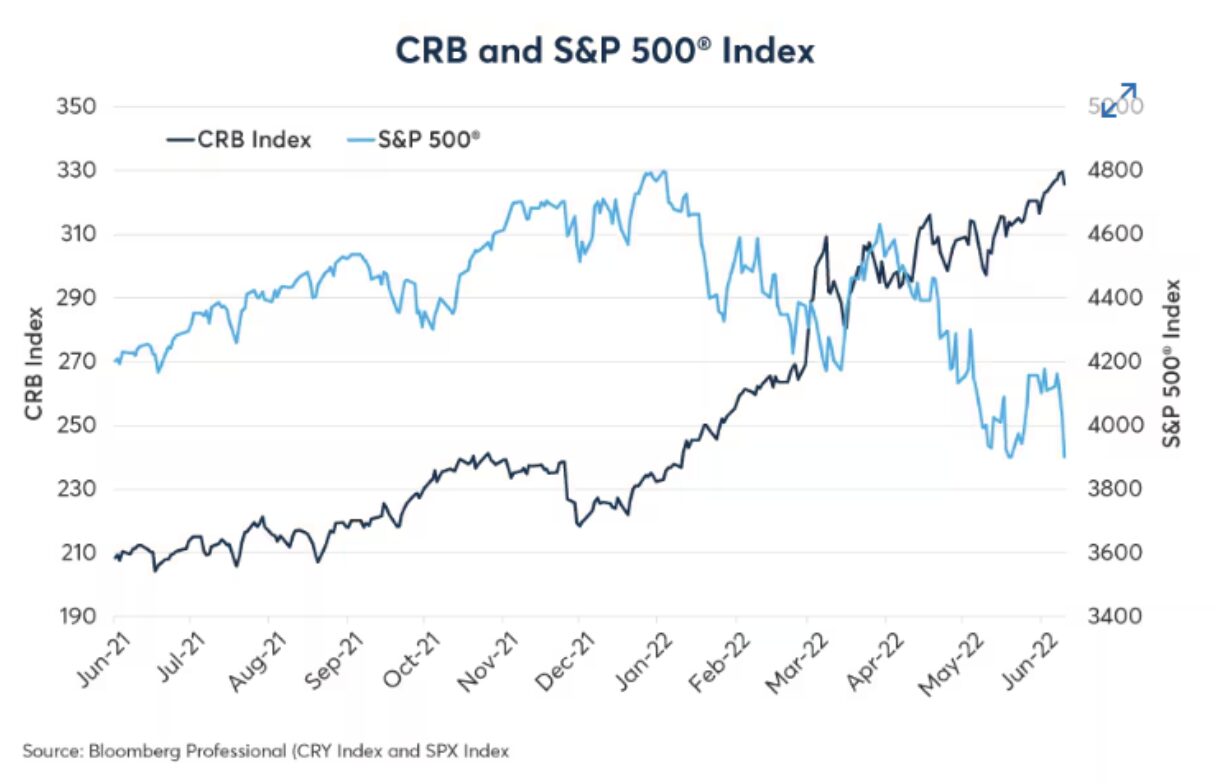
Commodities, especially precious metals like gold and silver, tend to retain their value during inflationary periods. As the cost of goods rises, the prices of commodities generally increase, protecting the purchasing power of your investment.
3. Potential for High Returns:
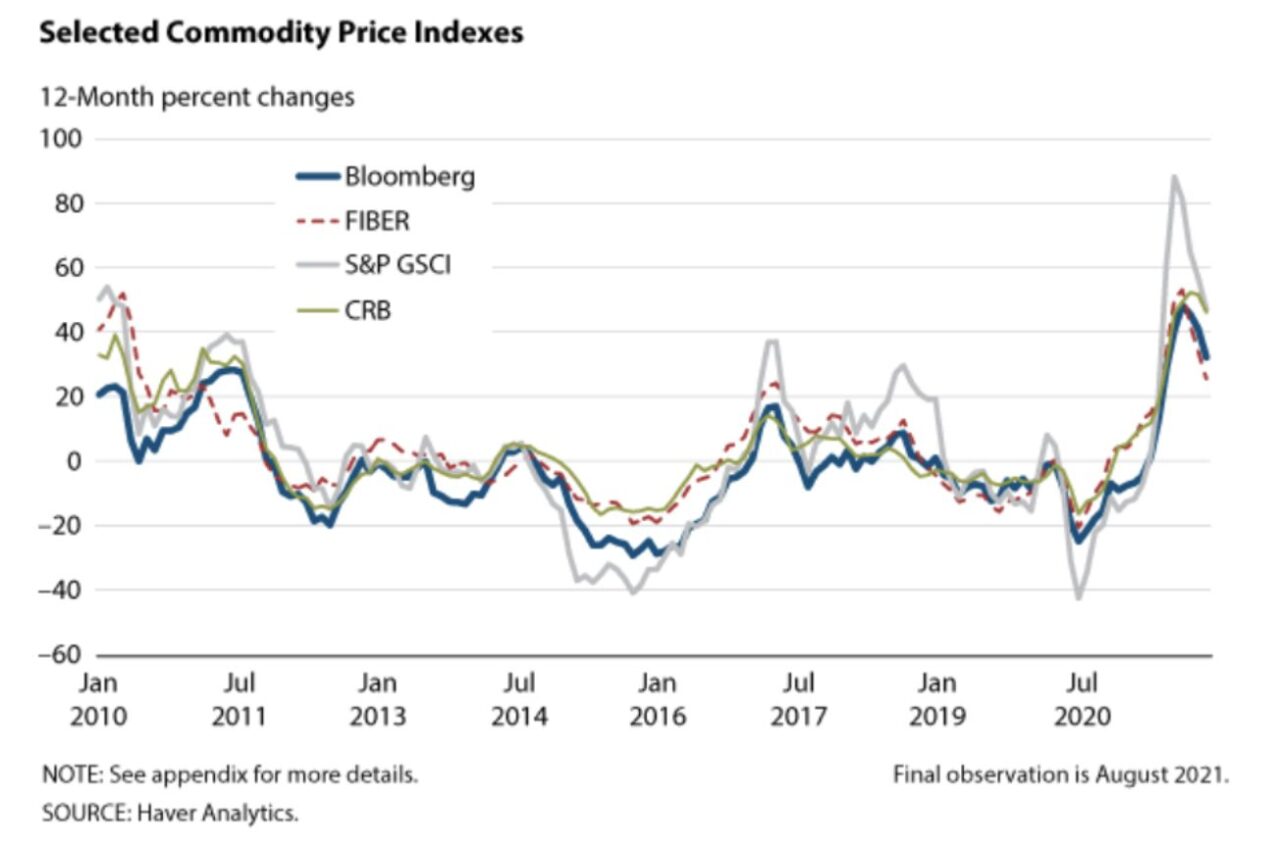
Commodities can be highly volatile, leading to significant price swings. This volatility presents opportunities for traders to achieve high returns if they correctly anticipate market movements.
4. Global Demand:
The demand for commodities is driven by global factors, including economic growth, population growth, and technological advancements. Investing in commodities can provide exposure to the global economy and benefit from rising demand in emerging markets.
5. Hedging Against Economic Events:
Commodities can act as a hedge against adverse economic events. For instance, during geopolitical tensions or natural disasters, certain commodities like oil or agricultural products may see price increases, providing a buffer against market downturns.
6. Speculation Opportunities:
Commodities markets offer numerous opportunities for speculation. Traders can take advantage of price movements caused by supply disruptions, seasonal trends, and other market dynamics.
7. Leverage:
Commodity futures and options allow traders to use leverage, meaning they can control a large position with a relatively small amount of capital. This can amplify both gains and losses, providing an opportunity for significant profit with a smaller initial investment.
8. Liquidity:
Many commodity markets are highly liquid, meaning there is a high volume of trading activity. This allows traders to enter and exit positions easily without significantly affecting market prices.
9. Real Assets:
Commodities represent real, tangible assets that are essential for everyday life, such as energy, food, and metals. Investing in commodities gives exposure to physical assets that have intrinsic value.
By trading commodities, investors can benefit from these advantages, balancing their portfolios and potentially enhancing returns while managing risk. However, it’s important to understand the complexities and risks involved, as commodity markets can be highly volatile and influenced by a wide range of factors.
Who are the Key Players?
There are different players in this market. The first distinction is between physical and financial players.
Physical players are those that are actually moving the commodities. For example, ExxonMobil is a key producer of oil and moves a big quantity of oil daily. Then you have physical players like Trafigura, one of the key trading houses in the world. This trade house trades most of the commodities via exploiting arbitrages.
Financial players are those that are not interested in taking ownership of the commodity, but are only looking at the derivative instrument.
Now that we know the difference between physical and financial players we can divide the participants in four major groups:
- Speculators: Seek to profit from price movements.
- Hedgers: Producers and consumers looking to manage risk.
- Investors: Looking to diversify their portfolios.
- Arbitrageurs: Exploit price differences in different markets.
How to use the Menthor Q Models to trade Commodities
For the purpose of this article we are going to look at how we can use the Q-Models to trade or risk manage our positions in. We have decided to use this asset, because within the commodity complex it is one of the most important and liquid ones.
As we noted earlier in this article, to trade effectively any commodity, these are the key points you want to keep in mind:
- Physical supply and demand
- Logistics
- Asset Volatility
- Positioning
- Systematic funds positioning
You can learn about Physical Supply & Demand and Logistics by doing more research. CBOE and CME are two great resources. From our side, we help you via our live Trading Rooms. More specifically we have one dedicated room to macro and commodities, you can access our rooms by signing up here.
Asset Volatility in Oil
Tracking volatility is very important when you trade oil or any other asset for that. There are several indicators that one may use. Let’s touch on some of the main ones here.
1. Oil Volatility Index (OVX): The OVX, also known as the “Oil VIX,” measures the market’s expectation of 30-day volatility in crude oil prices. It is derived from the prices of options on the United States Oil Fund (USO). Monitoring the OVX provides insights into market sentiment and expected price fluctuations.
2. Crude Oil Futures: Watching the prices and trading volumes of crude oil futures contracts on exchanges like the New York Mercantile Exchange (NYMEX) can provide real-time data on market expectations and volatility. The spread between different futures contracts (e.g., contango or backwardation) can also indicate market sentiment.
The structure of the futures curve is called Term structure. Every morning you can download it from our platforms either for futures or USO. This is a very important exercise for a trader. Because knowing the difference between contango or backwardation will define the type of strategy you may use. In a backwardation, the front of the futures curve is higher than the back (long end), that means that everytime you roll your future position you are making money. This structure also benefits investing in ETFs like USO. The opposite is true in contango.
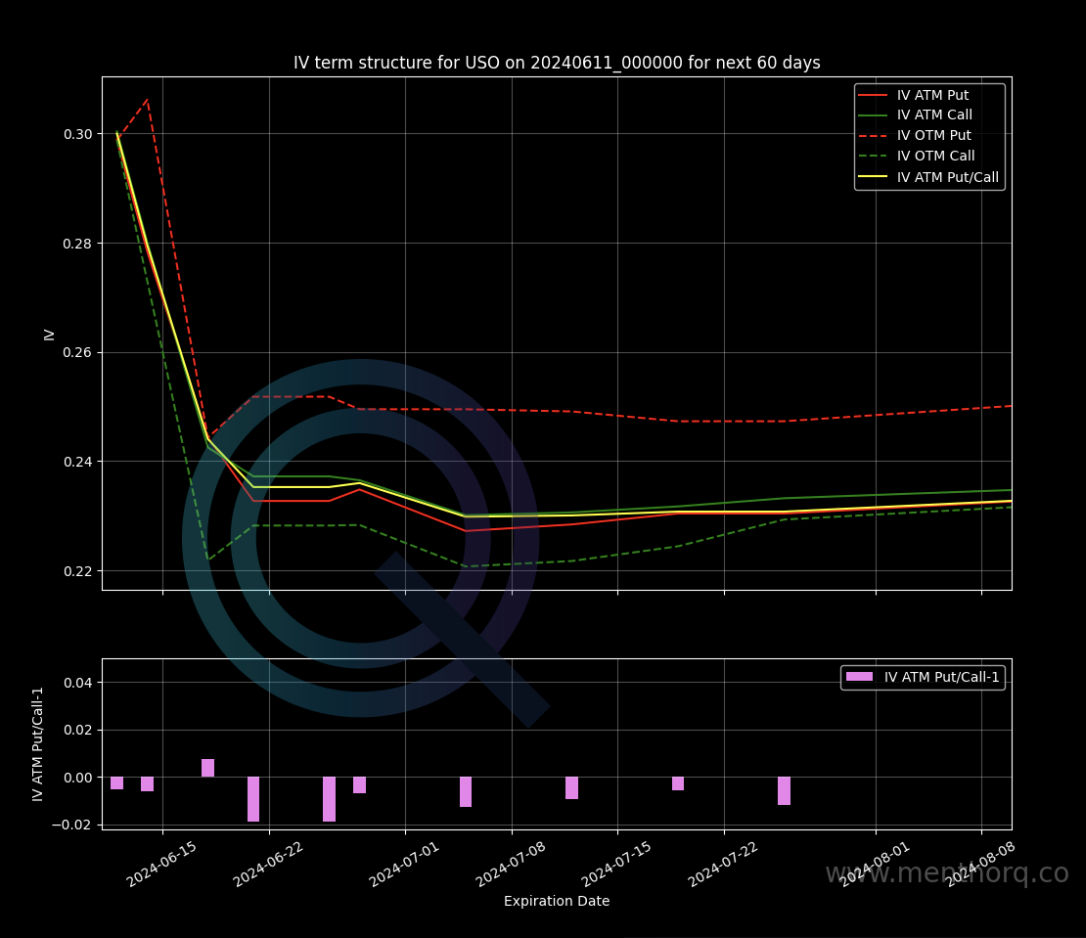
3. Options Market Activity:
Monitoring the activity in the oil options market, including changes in implied volatility and the prices of call and put options, can provide forward-looking indicators of expected price movements. In this case you want to look at the Skew of the CL or Brent depending on what you trade. A great way to start your day is by looking at the Option Matrix. This will allow you to have a better view of real time option positioning in the asset. We also track the various greeks and the put/call ratios. This is an important exercise to track sentiment.
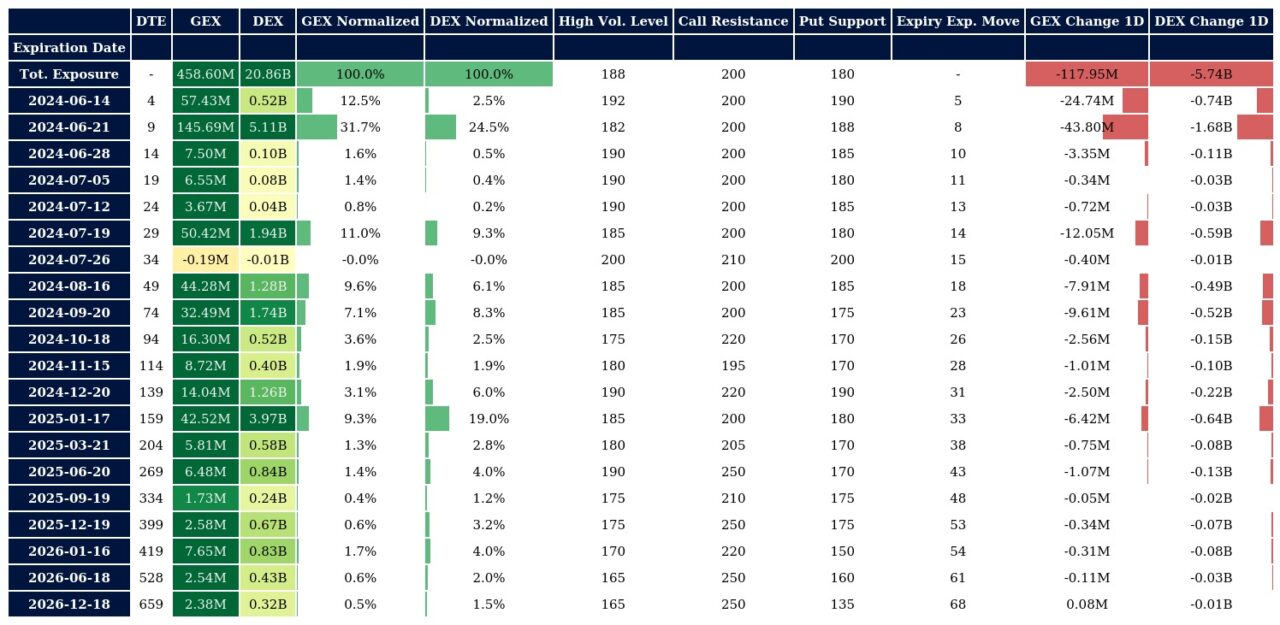
4. Volatility & Open Interest
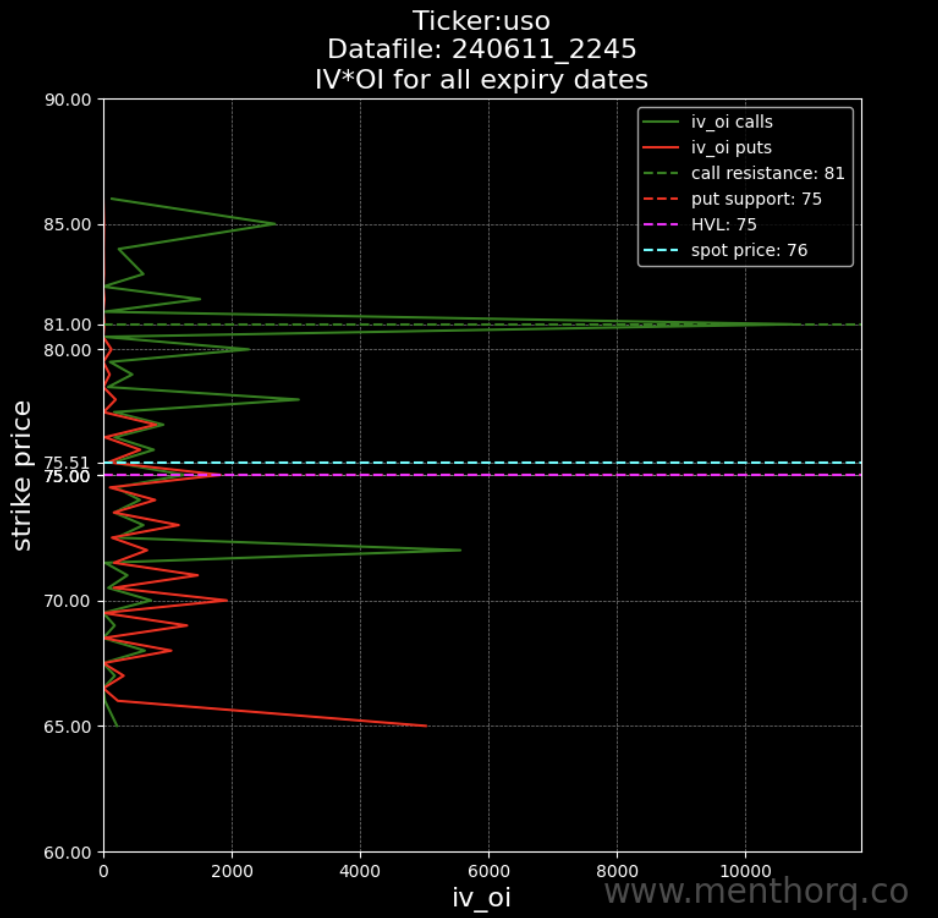
The other important chart that we like to look at is the IV*OI chart. What we really try to do here is identify those key strikes that have the most open interest and volatility. Because what we do know is that the strikes that are hit the most will become reaction zones. This is an important chart that can be used in conjunction with the gamma levels and Net Gex chart that we will cover further down in this article.
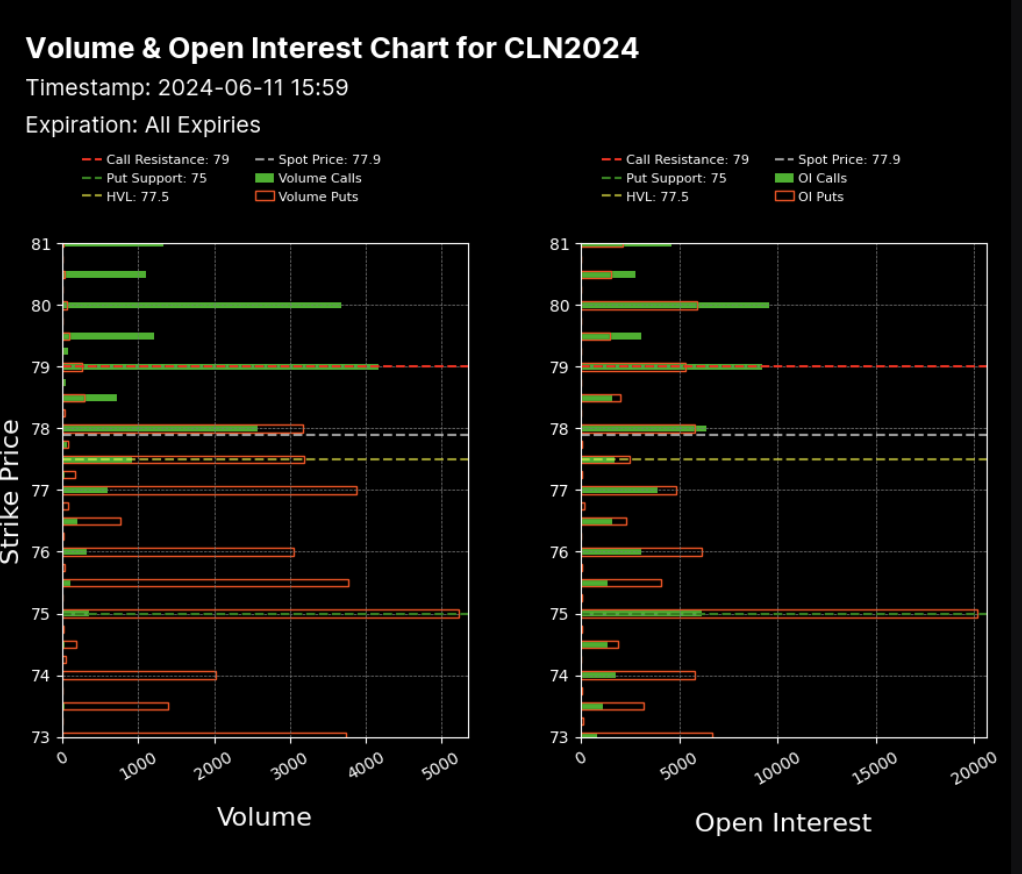
5. Open Interest and Volumes
Looking at the Open interest and volumes will allow you once again to see where there is must interest. This is another chart that should be looked at in conjunction with the OI*IV to identify the key strikes you want to trade.
6. Volatility-Tracking ETFs:
Exchange-Traded Funds (ETFs) such as the ProShares Ultra VIX Short-Term Futures ETF (UVXY) and the iPath Series B S&P 500 VIX Short-Term Futures ETN (VXX) can provide exposure to oil volatility. Tracking their performance can offer additional insights into market expectations.
Market Positioning
The other important due diligence we want to do before entering a trade is to look at positioning. What we know is that in oil participants use options in a bit of a different way than in equities. Let’s take a look.
1. Hedging:
- Producers (e.g., oil companies):
- Put Options: Producers might buy put options to hedge against a decline in oil prices. A put option gives the holder the right to sell oil at a specified price (strike price) by a certain date. If oil prices fall below the strike price, the put option gains value, offsetting the losses from selling oil at lower market prices.
- Consumers (e.g., airlines, refineries):
- Call Options: Consumers might buy call options to hedge against rising oil prices. A call option gives the holder the right to buy oil at a specified price by a certain date. If oil prices rise above the strike price, the call option gains value, reducing the impact of higher oil costs.
2. Speculation:
- Directional Bets:
- Buying Call Options: Speculators who believe oil prices will rise might buy call options to profit from the increase. If oil prices exceed the strike price before expiration, the call options can be sold at a profit or exercised to buy oil at below-market prices.
- Buying Put Options: Speculators expecting a decline in oil prices might buy put options. If prices fall below the strike price, the put options can be sold at a profit or exercised to sell oil at above-market prices.
- Selling Options: Speculators might also sell (write) options to earn premium income. However, this strategy carries higher risk as the seller is obligated to buy or sell oil if the option is exercised.
Obviously while players may use only one leg, most participants will take the above mentioned positions by using spreads to cap the risk on the structure.
Net GEX (Net Gamma Exposure)
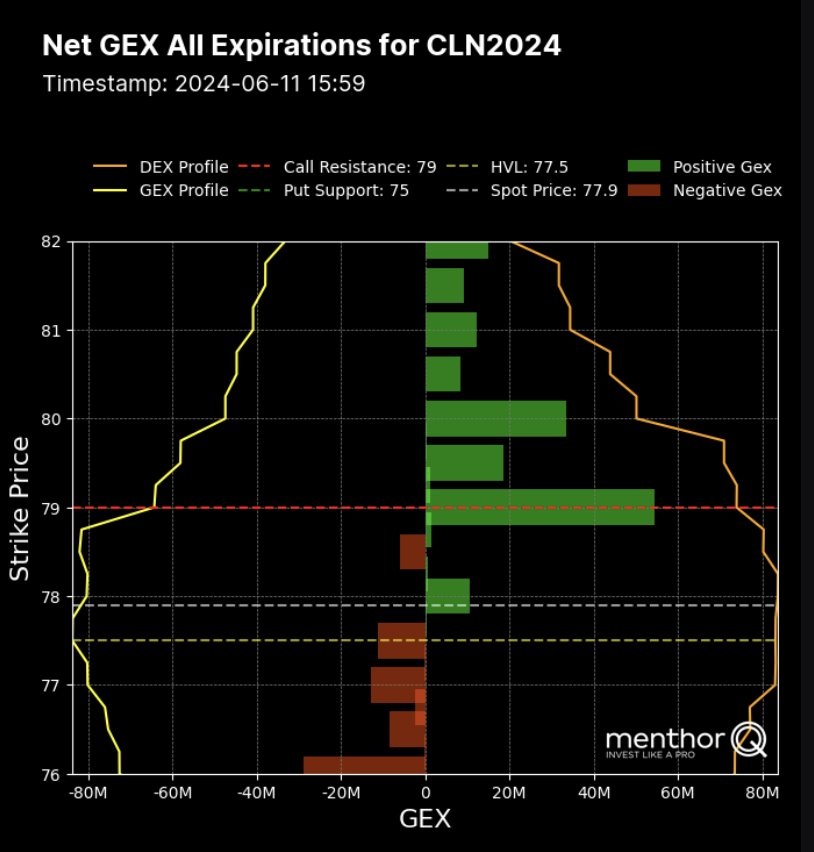
The first we always like to review when looking at positioning is Net Gex. Again there are two ways. The first thing we will look at is the Net Gex for Futures Options. Depending on the time frame of your trade, you can look at the positioning. For example, if you are trading short term you would look at Net Gex with expiry prompt month, if you are looking at the second month, you would look at Net Gex for that. As you can see in this chart, you will be able to look at the strikes with the highest concentration of options. The ones with higher concentration become Reaction Zones to be used for directional trades or spreads.
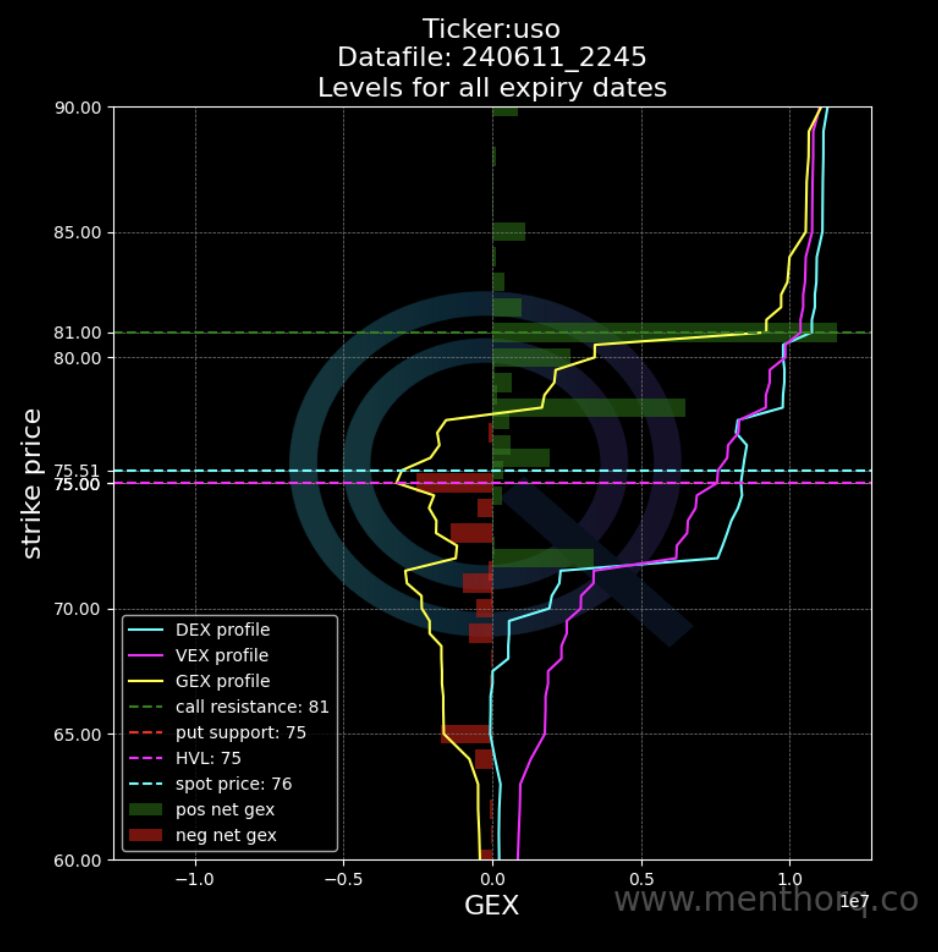
You can do the same exercise for USO, this way you can also cross check positioning within the biggest oil ETF.
Systematic Funds and CTAs
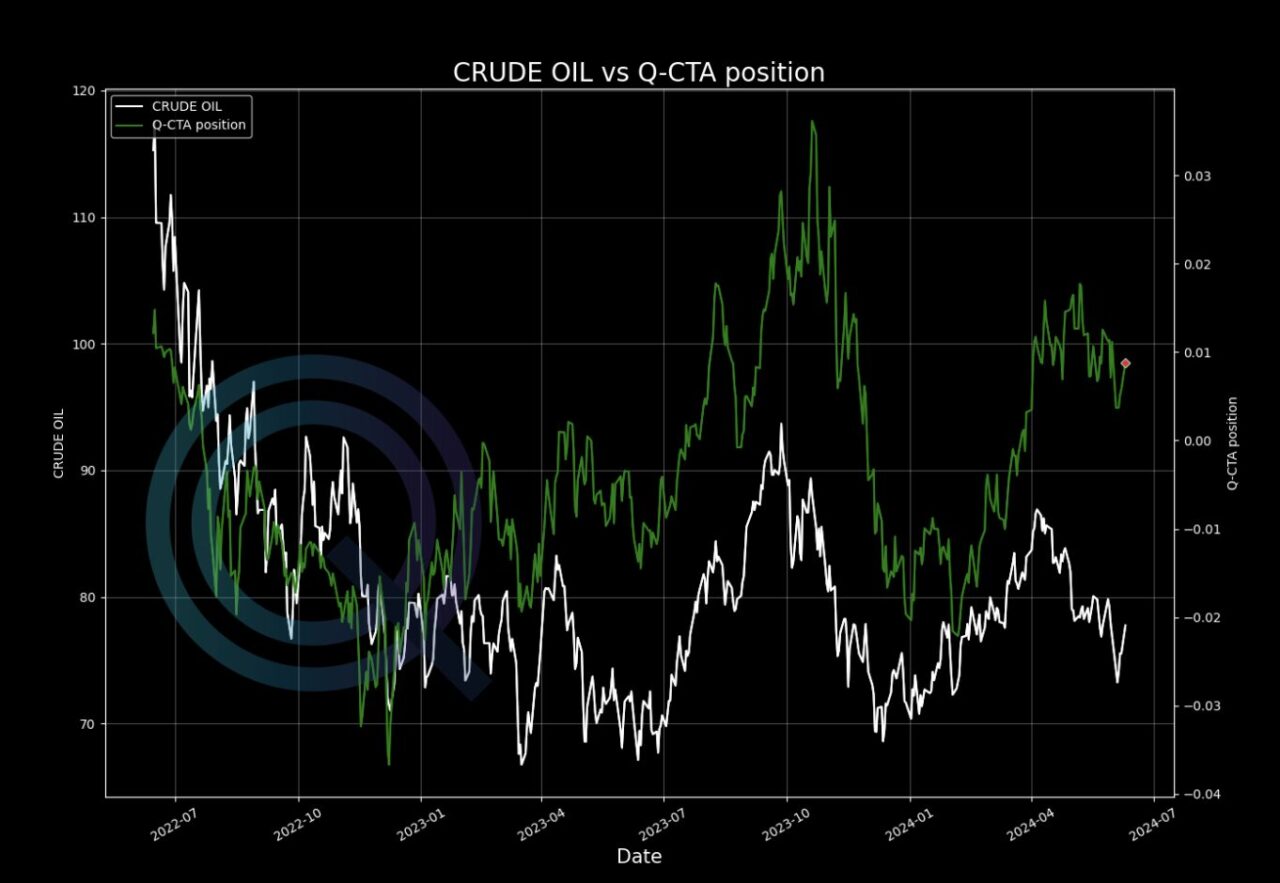
Once we have looked at Net Gex, we want to turn our focus to systematic funds. These particularly in commodities and oil are becoming more and more key participants. Our CTA charts can then be looked at in conjunction with the Net Gex. That gives us more information about those Reaction Zones. As you will notice if you trade oil, a lot of times, those key Net Gex levels also trigger prices for CTAs. This is how we would look at Crude Oil CTA.
You can learn more about our CTAs Model here.
Conclusion
Trading oil like any commodity requires a good understanding of the fundamentals. Once we have that understanding, then we can use the Q-Models to understand how positioning is looking in our asset and make more data driven decisions.
You can access our Models and Community by joining our Premium Membership.
