Value at Risk and Realized Volatility

Today we cover two important concepts that a trader should understand. One is Value at Risk also known as VaR and the other one is realized Volatility. We will walk you through these two concepts, and then we will look at our risk Vol control model and why it is worth looking at it to understand VaR and risk on sentiment.
What is Value at Risk (VaR)?
VaR is an important method that is widely used by banks and funds to manage risk. Like with all risk methods, there are imperfections, but it is one of the most standardized methods that a risk manager can use to monitor a trader’s book. Every trader in a fund/bank with a proper risk management will have a VaR, this number puts rails around the amount of daily risk a trader can take.
VaR is based on a statistical method and helps a risk manager manage the amount of potential loss that could happen over a period of time. VaR is defined as the maximum expected loss over a given time period at a certain confidence level. For example, if a portfolio has a one-day 5% VaR of $1 million, it means that there is a 5% probability that the portfolio will lose more than $1 million over a one-day period.
How to calculate VaR?
There are different methods, while we will not go into details here, these are the three methods:
- Historical Method: This method uses historical data to simulate potential losses.
- VaRiance-CoVaRiance Method: This is a parametric method that assumes normal distribution of returns and uses the mean and VaRiance of historical returns.
- Monte Carlo Simulation: This method uses computer algorithms to simulate a wide range of possible outcomes based on a statistical model.
Either method depends on what you are trying to calculate. For example the historical method works best if you are trading only one asset like the SPX, Tesla and so on, because historically there are specific price and volatility patterns that the VaR calculation can use. The VaRiance-CoVaRiance instead can be used for a series of combinations that have never been seen before.
What is Realized Volatility?
Realized volatility quantifies the true fluctuation in the value of a financial asset over a designated historical timeframe. This metric is derived by analysing the asset’s historical returns and determining the standard deviation, an indicator of the extent to which these returns VaRy from their average. This concept is distinct from implied volatility, which is inferred from option prices and represents the market’s projection of the asset’s future volatility.
Relationship of VaR with realized Volatility
At this point as one would expect, there is a direct relationship between VaR and realized Volatility. The higher volatility generally leads to higher VaR. This is because assets with higher volatility are more likely to experience significant price changes, which can result in larger potential losses.
So if realized volatility goes higher, VaR is telling the risk manager to tighten controls on the trader who has to liquidate, trade less or generally de-risk the book. This in the context of the markets should mean less liquidity and and risk off, or at least a market less bullish.
How can we use our Vol Control model?
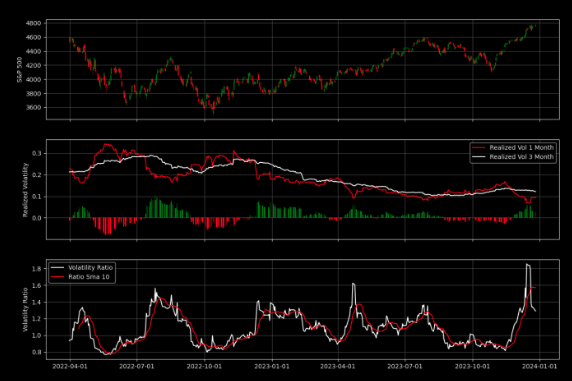
The Vol Control Model is explained in more details here. But the chart we want to focus on is the middle chart, where we compare 1 month to 3 month realized volatility.
When 1M RV re-sets lower there is a feedback loop, because as RV goes down, on the opposite side VaR goes up. This builds price momentum and trend re-builds to the upside as traders’ rails widen and more exposure can start building on their books.
Finally, remember we are using proxy here. We obviously do not have access to all the risk management tools of funds and banks. But as a proxy, this can be useful in this context and looked together with all our other tools.

