Vanna in Options Trading

In this article we are going to look at how the delta of the market maker changes based on greeks and spot price. It is a good time to cover this, because there is a lot of volatility in the market. Of course the geopolitical events are driving a lot of this, but it is always important to understand what happens below the hood. Because many times, certain moves while inexplicable based on what is happening, do have a technical explanation.
At this point, those that follow us know that we try to explain how liquidity is moving the market, and specifically when positioning in the option market changes. Since there is a lot to cover, we will split these concepts in two different articles.
Today we will cover:
- Delta
- Gamma Hedging
- Vanna Hedging
These are important topics that you want to add to your understanding of markets as a trader. Not only to make money but to also understand how to risk manage your book. We will also use our models to show you how to track some of these changes.
The Delta
We have covered Delta already in another Guide within the Resources section.
We want to understand what Delta is, when it becomes more positive and when more negative. But you will also see (very simplistically) investor positioning vs market maker. We say simplistically, because in the past some of you have pointed out that this is not correct. While it is not incorrect, it is simplified.
Today we will go a step further in order to show how that delta hedge changes with gamma, volatility and moneyness. But before continuing reading, please read the article above on Delta Hedging.
Gamma Hedging
First let’s revise quickly what gamma is. Gamma in options trading is used to measure the rate of change in an option’s delta concerning changes in the price of the underlying asset. It quantifies how sensitive the delta of an options position is to small price movements in the underlying asset.
As the gamma of the option changes, so does the Delta. That means that if you have a 50 Delta Call, also known as at the money, if your gamma is 20 your delta can potentially be moving in two directions:
- Up becoming a 70 Delta. To stay Delta hedged the market maker will have to short
- Down becoming a 30 Delta. To stay Delta hedged the market maker will have to go long
From a liquidity perspective, this is pretty straightforward. As the gamma moves that Delta, market makers will have to go long or short, meaning it will add or lower liquidity in the market as that delta changes.
These concepts are covered in great details within our Academy.
This is how a market maker is thinking about long and short gamma. We wrote an article about Positive and Negative Gamma.
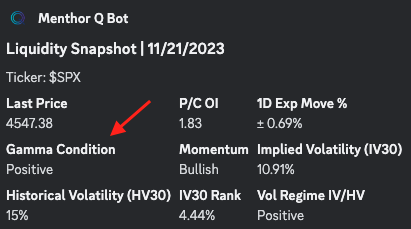
Another important part to understand is the importance of one of the Primary Level within our Models: The High Vol Level.
This is another important tool that you want to become familiar with when trying to assess where the market is going in terms of liquidity.
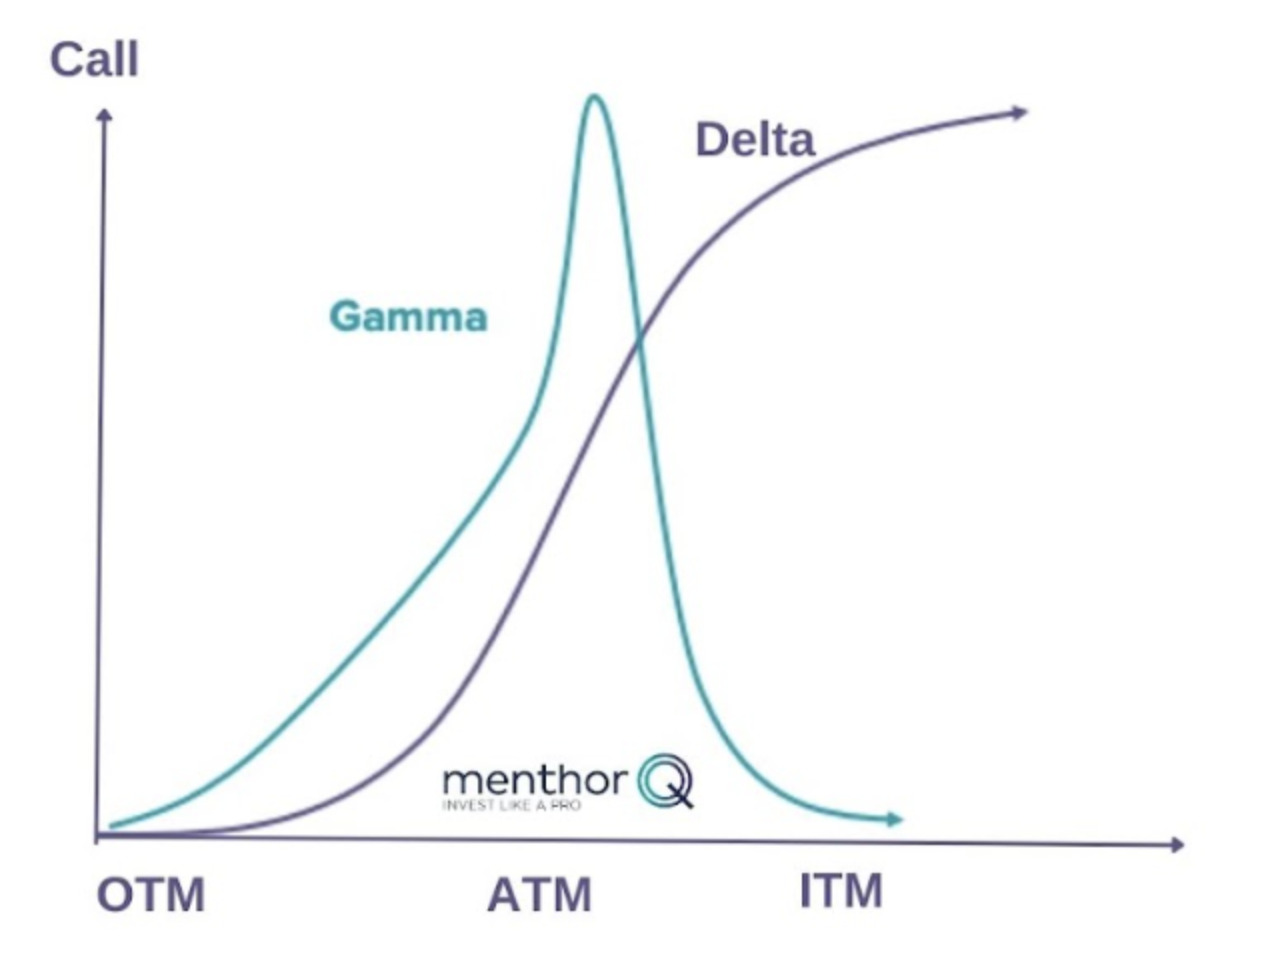
Gamma relation with Delta
As you can see in the below chart, as the spot price moves, the moneyness of the options changes. If you look at the delta profile it then becomes clear that, when we move towards the OTM, the delta or the options goes lower, while when it goes up that delta goes up. To delta hedge, the market maker as we said before will go long or short the underlying.
Vanna
Vanna is a second-order Greek in options trading. It measures how the sensitivity of an option’s delta (the rate of change in the option’s price concerning changes in the underlying asset’s price) changes in response to changes in implied volatility.
Vanna quantifies how an option’s delta is impacted by variations in both the underlying asset’s price and implied volatility.
If Delta Hedging was only a matter of gamma hedging, things would be a lot easier. Because all you would have to do is really adjust your hedge for gamma.
Unfortunately, we all know that what makes the markets “exciting” is implied volatility. When linked to hedging, we are really interested in vanna. You would have heard this concept on X before, but all it is, is the change of delta for change in implied volatility. Vanna is important because, as IV increases, it raises the deltas of maturities further from the strike.
There are a couple of ways for us to understand this concept. By taking a simple normal distribution chart, what we see is that in a 1 standard deviation move, prices will be moving within this cone (red arrow).
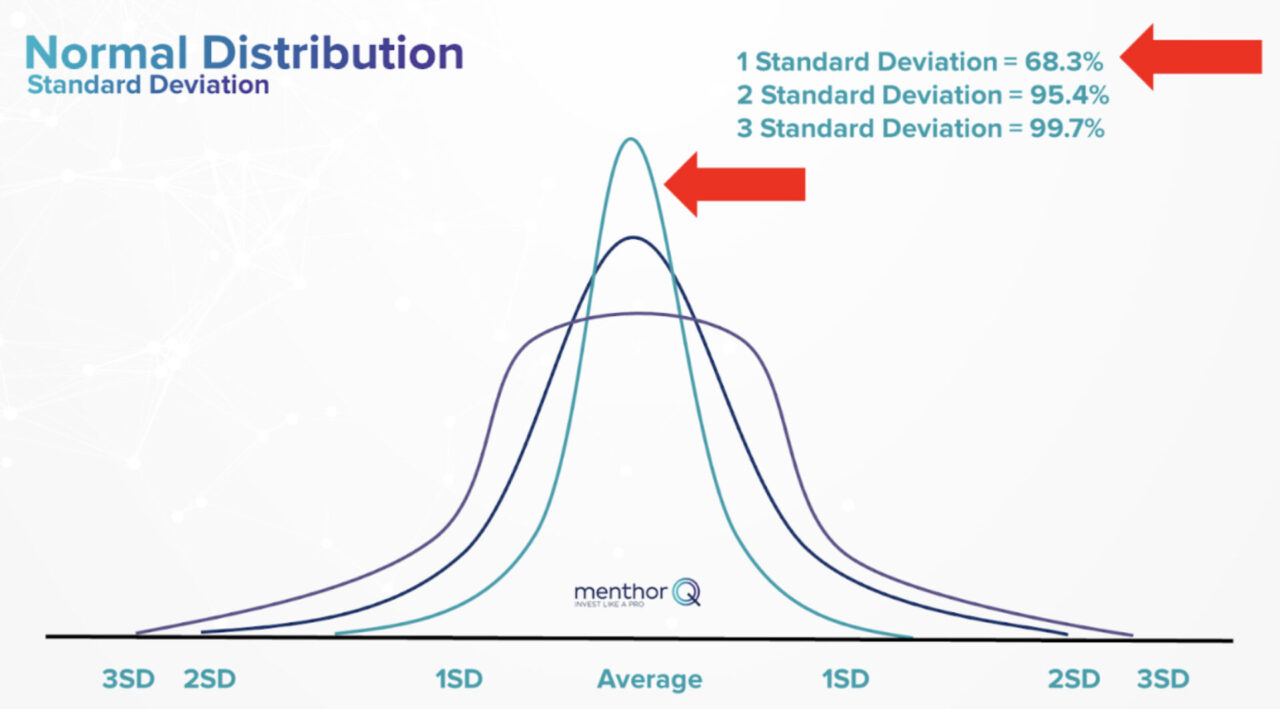
That means that the price movements are less wide. Prices swing less. Now if we move to a 3 standard deviation move, all of a sudden we see that price changes can be a lot wider.
Those cones can be represented as follows just to make it easier to visualize. All of this is covered in great detail in our Academy.
The higher the Implied Volatility, the wider that cone, and the wider the cone the wider the price swings. Again, this will have an impact on the Delta and how the market maker has to hedge the book.
How to read Vanna
If vanna is large, then the delta hedge is very sensitive to a movement in volatility.
If Vanna > 0
- As IV increases, we will see an increase in delta for our option. This is because higher volatility tends to increase the likelihood of the option ending up in the money, which affects delta. But why is that? That is because, when there is no volatility, our option has no gas. Meaning, with no volatility, there is a less likelihood that our OTM option would go in the money. Yet, if volatility increases, our chances that the option goes in the money increase. So when we have positive vanna, with IV rising, delta starts becoming more sensitive.
Vanna < 0:
- If Vanna is negative, we have the opposite effect, the option delta is just less responsive.
Vanna is also why moneyness becomes more important to delta hedging. Let’s take OTM puts. Those can be on the tails of the market without really meaning much in a low volatility environment. However, as volatility increases, in terms of liquidity those can start having a big impact.
Because all of a sudden, the market maker will have to start adjusting its delta as those OTM puts start getting closer to the money due to volatility. In those cases, as the delta increases, the market maker will have to start shorting the market to remain hedged, and that can have a deep impact on the market.
Vanna and Delta Hedging
Vanna as we had said is the reason why moneyness becomes more important to delta hedging.
Let’s take OTM puts. Those can be on the tails of the market without really meaning much in a low volatility environment.
However, as volatility increases, in terms of liquidity those can start having a big impact. Because all of a sudden, the market maker will have to start adjusting its delta as those OTM puts start getting closer to the at the money due to volatility.
In those cases, as the delta increases, the market maker will have to start shorting the market to remain hedged, and that can have a deep impact on the market.
Now let’s try to understand why vanna is so important when the Put Support Level is so high. In the guide we explain how we can leverage the Put Support.
As puts get ATM/ITM, investors that had been buying those options for protection, as a hedge, are going to change their positioning. This level is the level where there is most put positioning, and one would expect that once we get to that level, those puts get monetized by hedgers.
If a hedge is not monetized, the investor cannot realize the benefit of being hedged. As they get monetized, hedges (puts) are closed, and market makers close their shorts creating a sort of short squeeze – price bounces on that level and back up.
What about Implied Volatility?
Implied Vol needs to be monitored too, because changes in IV will also drive flows. If the IV that is driving put flows slows down, that will affect market makers’ delta hedge as well. They will in fact buy back shorts – this is what drives the bounce. Vanna, while more complicated than gamma in this context, is extremely important when thinking about how market makers are hedging. Vanna looks at the change in delta due to implied volatility.
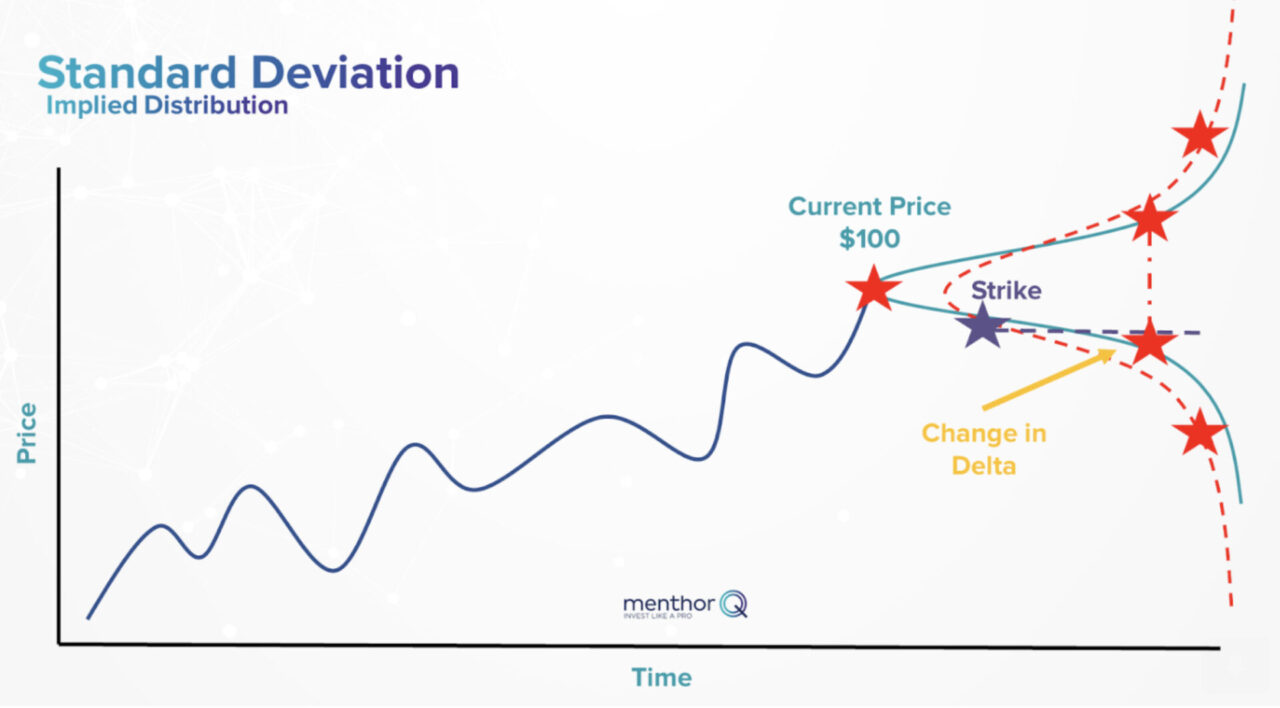
Let’s take last week’s chart to understand this concept better. Let’s assume that based on the current price the strike of our Put is Out of the money.
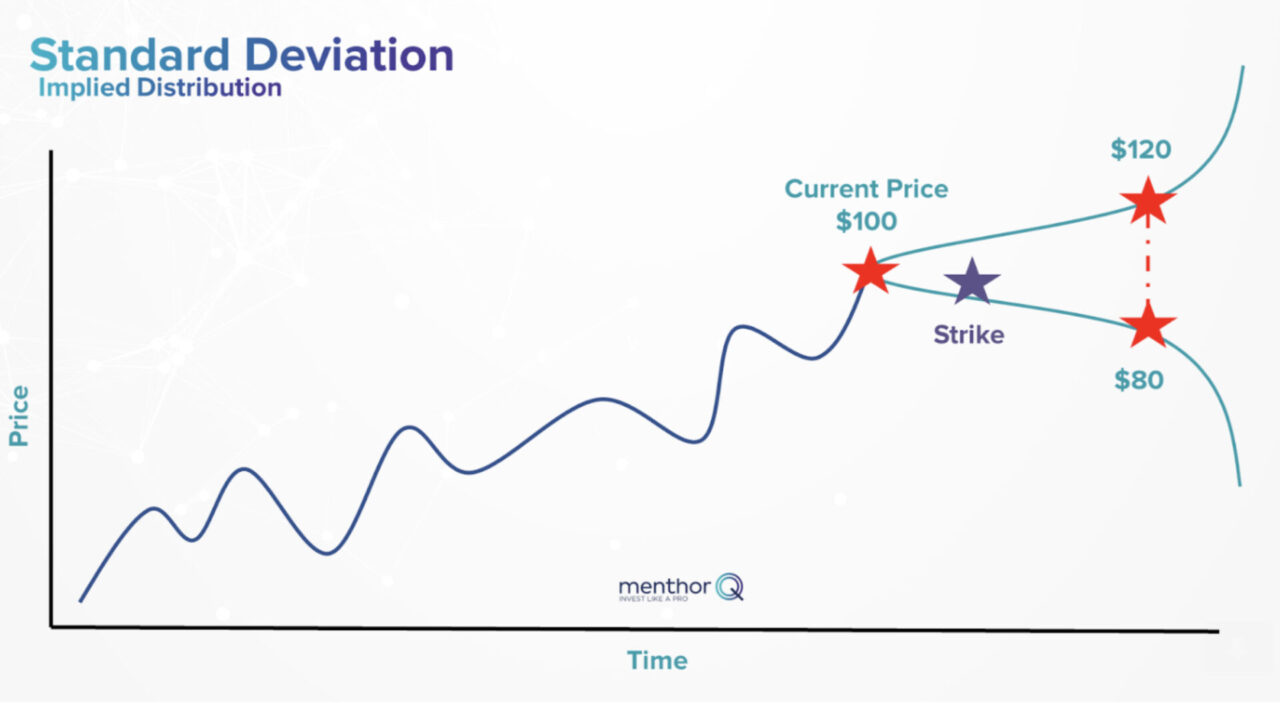
On his side the market maker, that increase in implied volatility will mean that it’s delta will increase. Change in Delta can be seen in yellow. The dotted red line is the implied distribution, and as a result of increasing implied volatility price range increases.
The market maker in this situation, a vanna kicks in, is forced to short more of the underlying to stay delta hedged.
