Volatility
Volatility refers to the degree of variation in the price of a financial instrument (such as a stock, currency pair, or commodity) over time. It is a statistical measure of the dispersion of returns for that instrument. In simpler terms, volatility reflects how much and how quickly the price of an asset can change in a given period.
Volatility is key in trading for several reasons:
- Risk Assessment: Higher volatility generally implies greater price fluctuations, which can lead to increased trading risk. Traders and investors often use volatility measures to assess the risk associated with a particular asset or market.
- Trading Opportunities: Volatile markets can present trading opportunities.
- Option Pricing: Volatility is a key component in the pricing of options. Higher volatility typically leads to higher option premiums because there is a greater likelihood of the underlying asset experiencing larger price movements.
- Risk Management: Traders can adjust their position sizes and risk tolerance based on the expected volatility of the asset they are trading.
Volatility can be measured in various ways, with the two most common measures being historical volatility and implied volatility. We also have a third type of Volatility: Market Volatility which is measured by looking at the VIX Index. Let’s look at them in more detail.
Historical Volatility
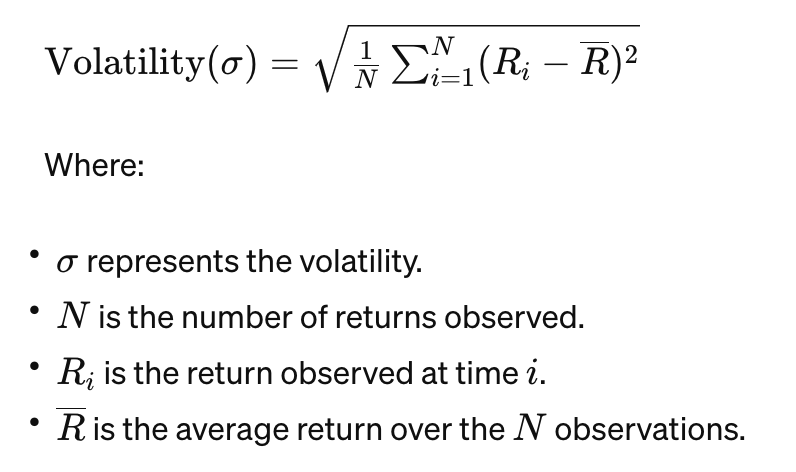
Historical volatility, often referred to as historical price volatility or realized volatility, is a statistical measure of the past price fluctuations or variability in the prices of a financial asset over a specific historical period. It provides insight into how much an asset’s price has deviated from its average or mean price over time.
Historical volatility is calculated using historical price data and is typically expressed as a percentage or an annualized figure. Historical volatility provides a retrospective view of an asset’s price movements and is a backward-looking measure and does not necessarily predict future price movements.
It is useful for understanding an asset’s historical behavior and assessing how it may perform under similar conditions in the future, but it does not account for new information or events that may impact future volatility.
Implied Volatility
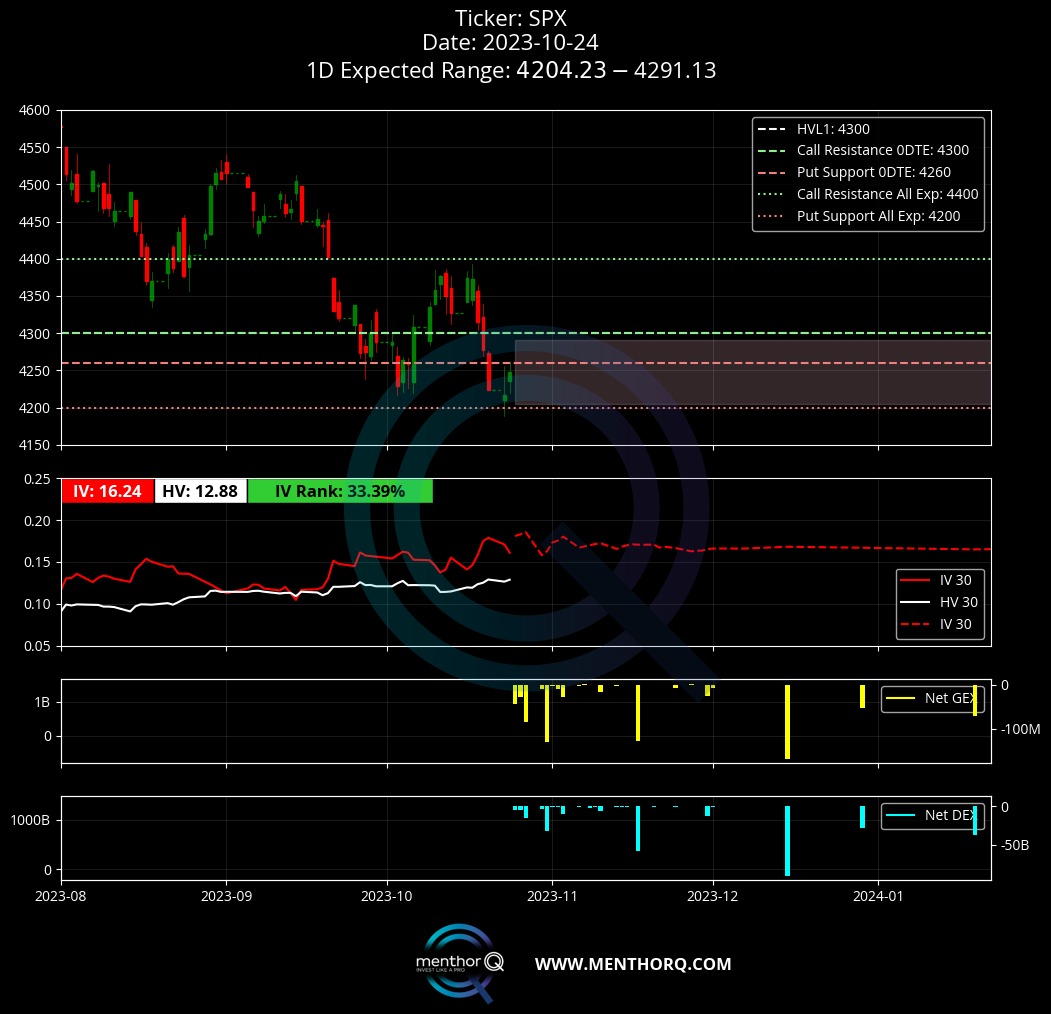
Implied volatility is an important concept in options trading and represents the market’s expectation of a financial asset’s future price volatility. Unlike historical volatility, which is based on past price movements, implied volatility is forward-looking and is derived from the prices of options on the asset.
It reflects the market’s perception of how much an asset’s price is likely to fluctuate in the future and is a key component in options pricing models like the Black-Scholes model. Traders often use implied volatility to gauge market sentiment and potential price movements.
Within the Menthor Q Models you can access the Chart of Historical vs Implied Volatility via our Free Daily Report.
Market Volatility: The VIX Index
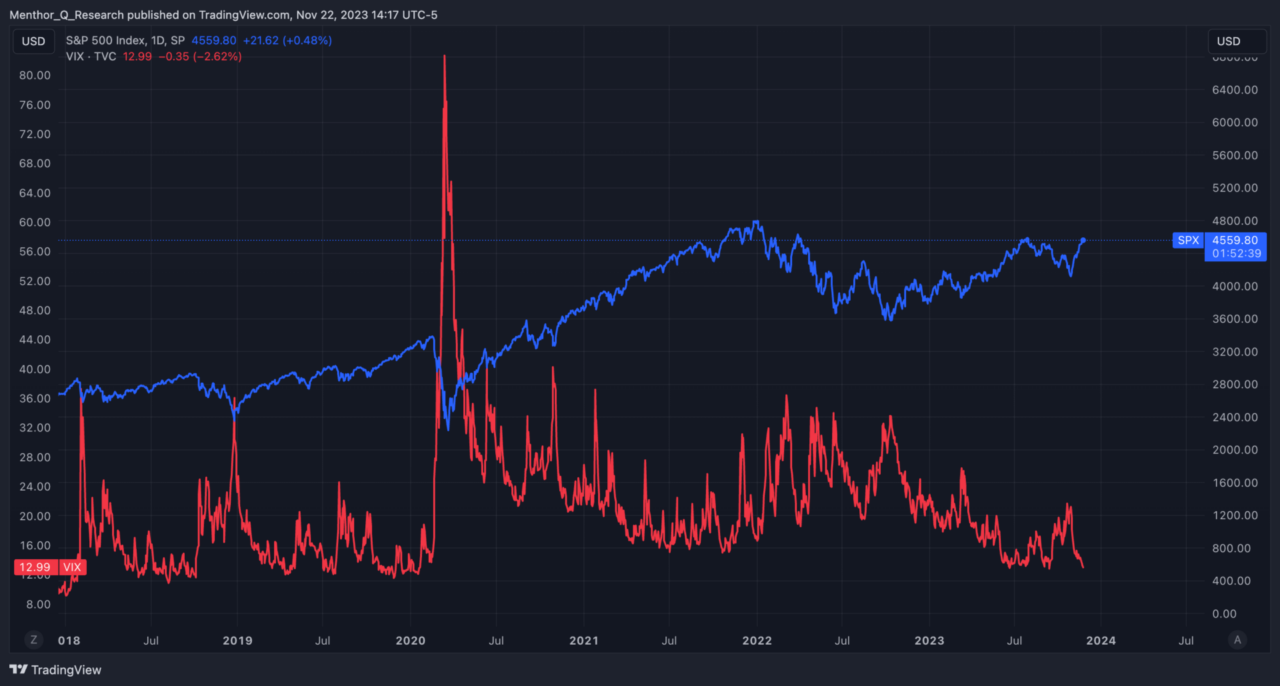
There is a third type of volatility which is the overall market volatility. The VIX, or Volatility Index, is a popular measure of market volatility and investor sentiment.
It is often referred to as the “fear index” because it tends to rise when market participants expect increased uncertainty or price fluctuations in the stock market.
The VIX is formally known as the CBOE Volatility Index because it was originally created and is still maintained by the Chicago Board Options Exchange (CBOE).
The VIX is calculated using the prices of a specific set of options on the S&P 500 Index, a widely followed benchmark of U.S. stock market performance. It measures the market’s expectation of future volatility over the next 30 days. Specifically, the VIX reflects the implied volatility of S&P 500 index options.
The VIX typically has an inverse relationship with the stock market. When the VIX rises, it often corresponds to a decline in stock prices, as increased volatility is often associated with falling markets. A falling VIX may correspond to rising stock prices.
How to read the VIX Levels?
The price of the VIX is highly significant in understanding market sentiment and volatility. Here are some reference values for interpreting the VIX:
- A VIX equal to or below 20/25 indicates a predominantly bullish situation because volatility is relatively low.
- A VIX above 20/25 but below 35 describes a tense scenario, but not necessarily bearish.
- A VIX above 35 indicates a dangerously volatile scenario with significant bearish implications and strong price movements of assets.
Relationship between Gamma and Volatility
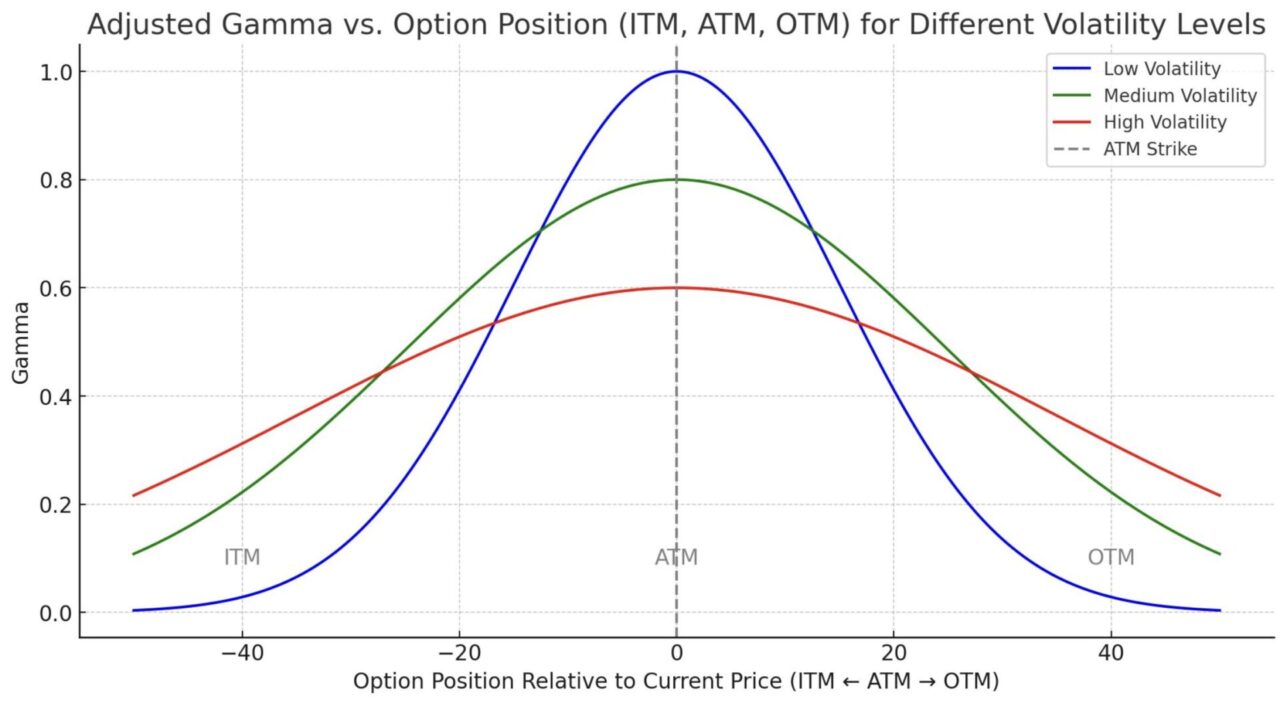
One thing to keep in mind, as we move in negative gamma (slightly at the moment), higher volatility will change the gamma profile of options and its delta.
As volatility increases, the gamma curve flattens. In this chart the blue line is the the gamma profile in a low IV environment, while the red line is the gamma curve in a high IV environment.
- Low Volatility (Blue): The gamma curve should be higher, indicating higher sensitivity of delta to price changes in the underlying asset.
- Medium Volatility (Green): The gamma curve should be lower than in low volatility, showing reduced sensitivity.
- High Volatility (Red): The gamma curve should be the lowest among the three, reflecting the least sensitivity of delta to price changes in the underlying.
If you want to go a little deeper, and market dynamics associated with volatility we wrote an article about Gamma, Delta and Vanna.
